

RF engineer interviews are technical screens that test whether a candidate can reason about radio-frequency circuits and systems with numbers, not just definitions. Most ask about return loss and VSWR, the Smith chart, noise figure and cascades, P1dB and IP3, PLLs and phase noise, and receiver front-end architecture, often as short calculations done on a whiteboard.
This page collects the questions that come up most often, grouped by topic, with model answers and the arithmetic an interviewer usually expects. It is part of the RF careers and learning section, and each answer links to the full tutorial in the RF design guide. Interviewers vary a great deal by company and role, so treat this as a core set to be fluent in, not a script.
Fundamentals
1. Why do most RF systems use 50 Ω?
For an air-dielectric coaxial line, attenuation is lowest at a characteristic impedance of about 77 Ω and peak power handling is highest at about 30 Ω. 50 Ω is a compromise between the two that became a standard. A good answer adds that 75 Ω is still used where low loss matters more than power, such as cable television and video.
2. What is the thermal noise floor, and where does −174 dBm/Hz come from?
Available thermal noise power is kTB. At the reference temperature of 290 K, kT = 4.00 × 10⁻²¹ W/Hz, which is −173.98 dBm/Hz and is rounded to −174 dBm/Hz. Adding 10log10(B) gives the noise in a bandwidth B, for example −114 dBm in 1 MHz. See thermal noise and kTB.
Return Loss, VSWR and the Smith Chart
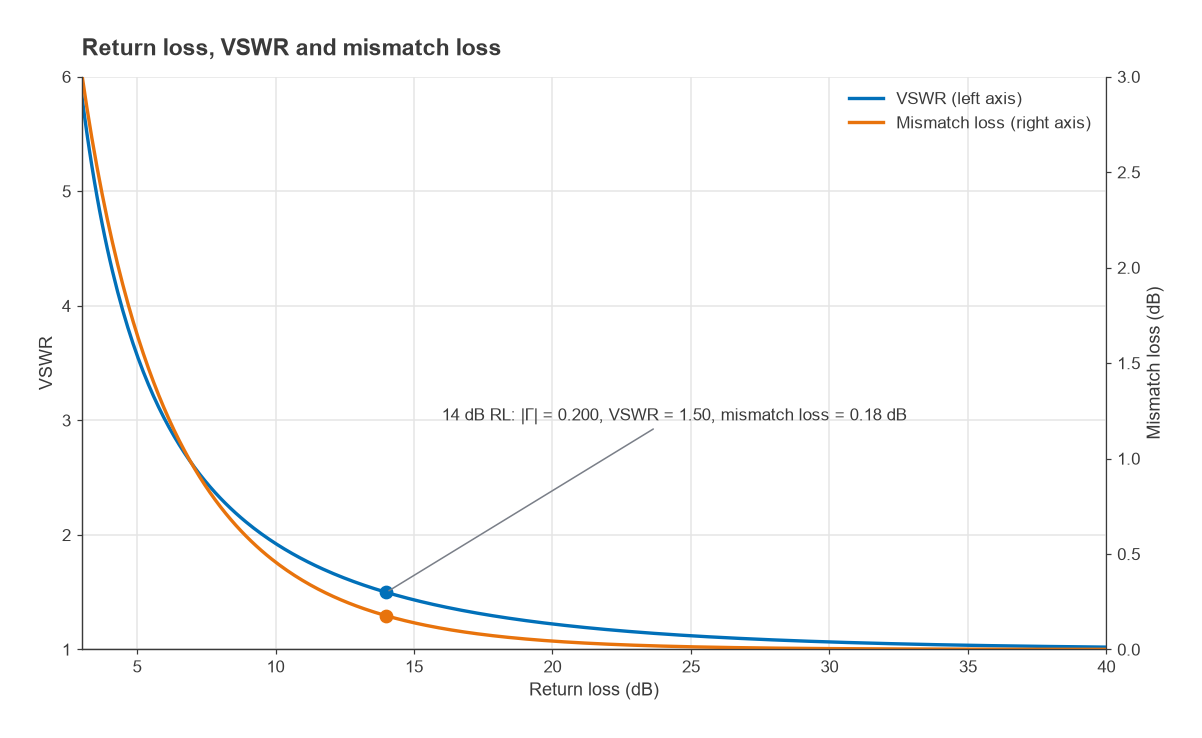
3. Convert 14 dB return loss to VSWR and mismatch loss
Start from the reflection coefficient: |Γ| = 10−RL/20 = 10−0.7 = 0.200. Then VSWR = (1 + |Γ|)/(1 − |Γ|) = 1.50, and mismatch loss = −10log10(1 − |Γ|2) = 0.18 dB. The interviewer is usually checking two things: that you use 20log for a voltage ratio, and that you know a “poor-looking” 1.5:1 VSWR loses less than 0.2 dB. The VSWR and return loss page has the full set of conversions.
4. Where is 25 + j25 Ω on a 50 Ω Smith chart?
Normalise first: z = 0.5 + j0.5. The point lies on the r = 0.5 circle in the upper (inductive) half. Its reflection coefficient is Γ = (Z − Z0)/(Z + Z0) = (−25 + j25)/(75 + j25) = −0.2 + j0.4, which is |Γ| = 0.447 at an angle of 116.6°, giving VSWR = 2.62. Strong candidates then sketch a match: moving along a constant-conductance circle with a shunt capacitor, then along a constant-resistance circle with a series element. Review the Smith chart guide before any interview.
5. How would you match 50 Ω to 100 Ω over a narrow band?
Two common answers are an L-network or a quarter-wave transformer with ZT = √(50 × 100) = 70.7 Ω. Mention the trade-offs: the L-network is compact and lumped, while the quarter-wave transformer is easy on a PCB at microwave frequencies but is long at low frequencies and narrowband unless more sections are added.
Noise Figure and Sensitivity
6. Calculate the noise figure of this receiver chain
A typical prompt: an LNA (gain 15 dB, NF 1 dB), a filter (loss 2 dB, so NF 2 dB), a mixer (conversion loss 7 dB, NF 8 dB) and an IF amplifier (gain 20 dB, NF 4 dB). Convert everything to linear ratios and apply the Friis formula, Ftotal = F1 + (F2 − 1)/G1 + (F3 − 1)/(G1G2) + … The cumulative noise figure is 1.00 dB after the LNA, 1.06 dB after the filter, 1.89 dB after the mixer and 2.84 dB at the output.
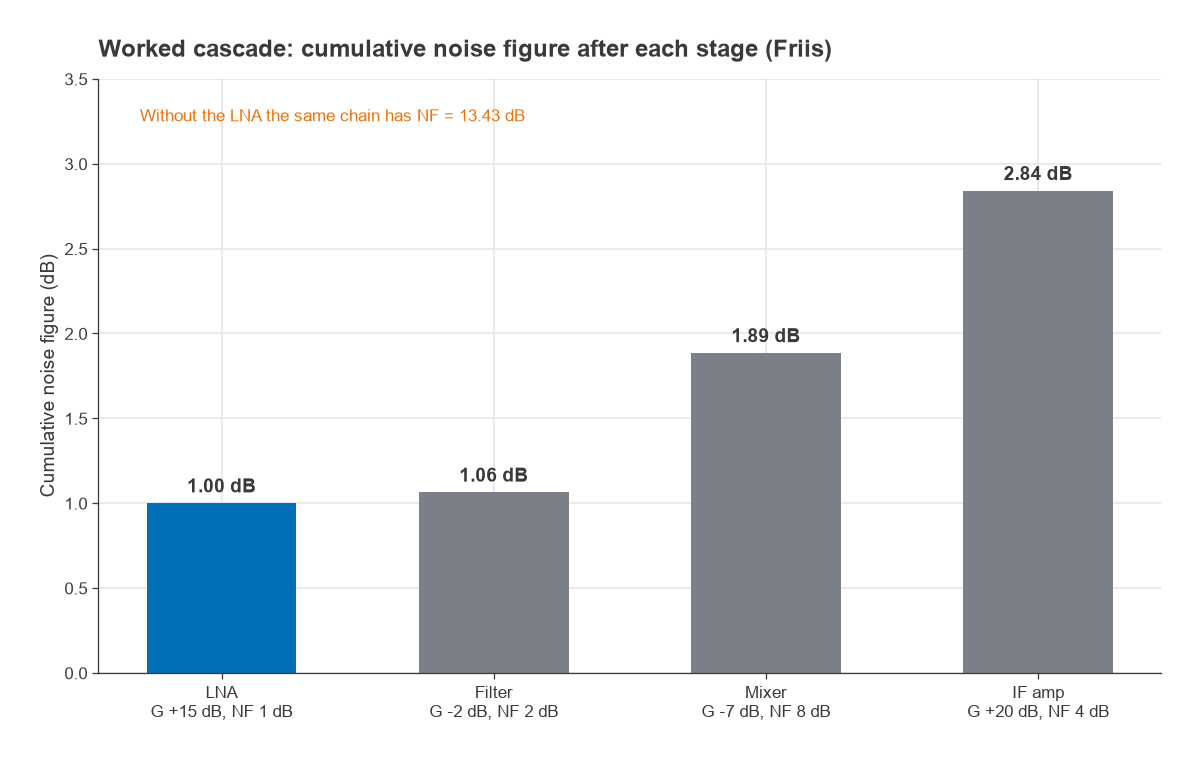
The follow-up is almost always “what if the LNA were removed?” The same chain without it has a noise figure of 13.43 dB, because the lossy filter and mixer now sit at the front. That is the reason an LNA goes first, and why loss before it adds directly to the system noise figure. The cascaded noise figure and noise figure pages cover the derivation.
7. What is the sensitivity of that receiver?
Sensitivity = −174 dBm/Hz + 10log10(B) + NF + SNRmin. With B = 1 MHz and a required SNR of 10 dB, the chain above gives −174 + 60 + 2.84 + 10 = −101.2 dBm. Without the LNA it would be −90.6 dBm, more than 10 dB worse. See receiver sensitivity.
Linearity: P1dB and IP3
8. What are P1dB and IP3, and how are they related?
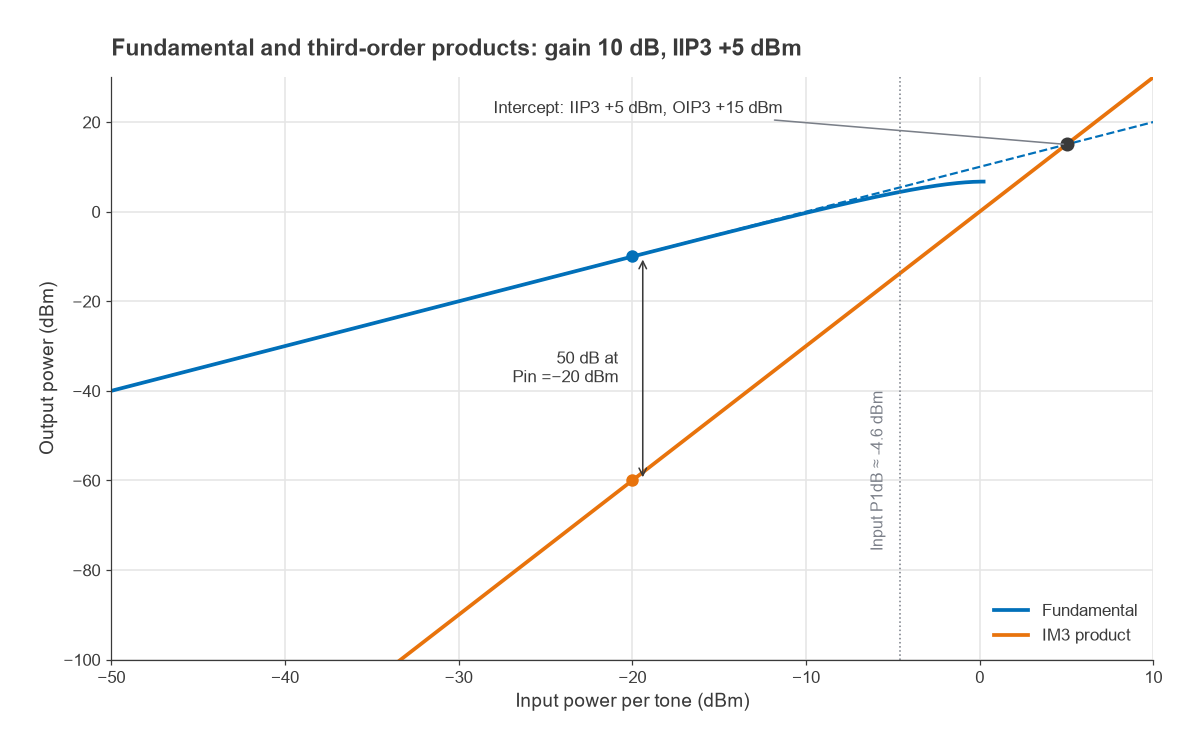
P1dB is the power at which gain has fallen 1 dB below its small-signal value. IP3 is the extrapolated point where the fundamental output and the third-order intermodulation product would be equal; the IM3 product rises 3 dB for every 1 dB of input. For a device dominated by a simple cubic nonlinearity, input P1dB is about 9.6 dB below IIP3. Real amplifiers often deviate from that rule, so state it as an approximation. Read P1dB compression and intermodulation and intercept points.
9. Two tones at −20 dBm each enter an amplifier with 10 dB gain and IIP3 of +5 dBm. Where are the IM3 products?
Each fundamental leaves at −10 dBm, and OIP3 = IIP3 + G = +15 dBm. The IM3 level is PIM3 = 3Pout − 2·OIP3 = −30 − 30 = −60 dBm, which is 50 dBc below each tone. A quick check: the gap between tone and IM3 is 2(OIP3 − Pout) = 2 × 25 = 50 dB. The products fall at 2f1 − f2 and 2f2 − f1, close to the wanted signals, which is why filtering cannot remove them.
PLLs and Phase Noise
10. Explain how a PLL synthesiser works
A phase-frequency detector compares a reference with the divided VCO output, a charge pump and loop filter turn the error into a tuning voltage, and the loop settles when fout = N × fPFD. Inside the loop bandwidth, the output phase noise follows the reference and PFD noise; outside it, the VCO’s own noise dominates. The PLL frequency synthesis article covers the details.
11. Why does a large divide ratio hurt phase noise?
In-band noise referred to the PFD is multiplied by N, which raises it by 20log10(N) dB at the output. Synthesising 2.4 GHz from a 1 MHz comparison frequency means N = 2,400, a penalty of 67.6 dB. Fractional-N synthesis allows a much higher comparison frequency for the same channel step, which lowers N and the in-band noise. Phase noise explains how this spreads into adjacent channels.
Front-End Architecture
12. What is the image frequency in a superheterodyne receiver?
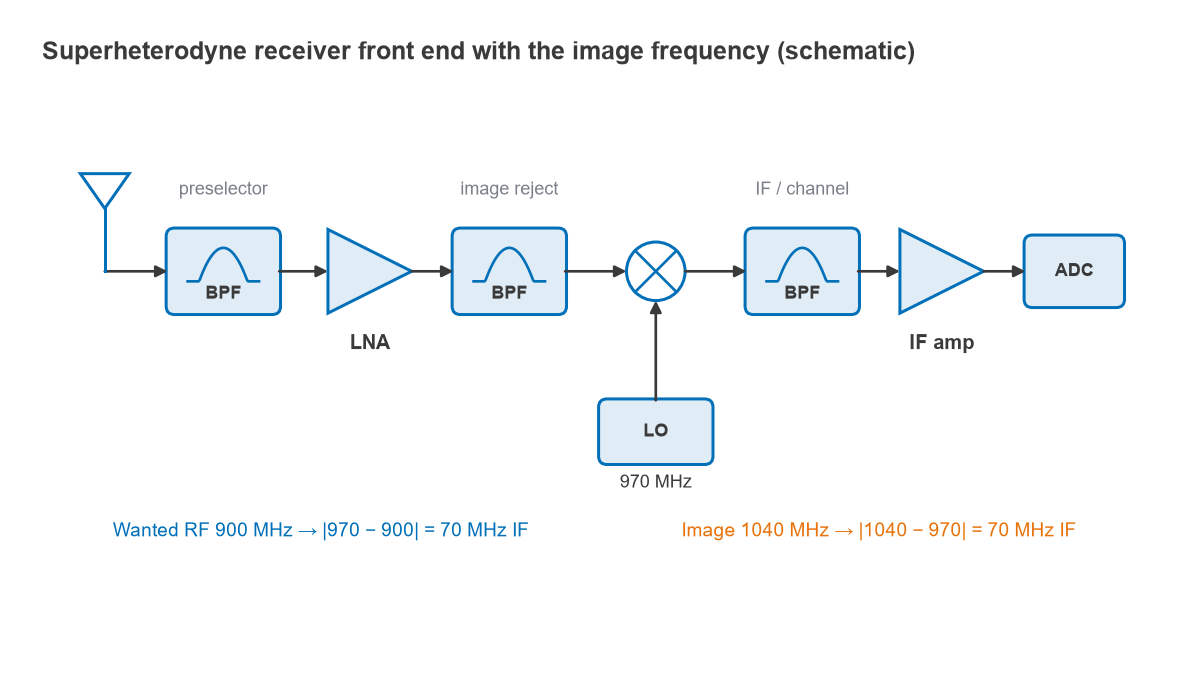
With a wanted signal at 900 MHz, a 70 MHz IF and a high-side LO at 970 MHz, a signal at 1,040 MHz also mixes to 70 MHz. That is the image, separated from the wanted signal by twice the IF. It must be removed by filtering before the mixer, or cancelled with an image-reject mixer. A higher IF makes filtering easier but moves the IF filter to a higher frequency. See image frequency rejection.
13. Compare superheterodyne and zero-IF receivers
A superheterodyne receiver has good selectivity and no DC problems but needs image and IF filters. A zero-IF receiver has no image in the usual sense and integrates well, but it suffers from DC offsets, LO leakage and self-mixing, flicker noise and I/Q imbalance. The receiver architecture comparison sets the options side by side.
Practical and Measurement Questions
- An amplifier oscillates on the bench. What do you check? Stability factor K and |Δ| across the whole band including low frequencies, bias decoupling, grounding and layout feedback paths. See amplifier stability.
- How do you calibrate a VNA? Describe SOLT or TRL, where the reference plane ends up, and how to verify the calibration. See VNA calibration.
- How do you measure noise figure? The Y-factor method with a calibrated noise source is the standard answer. See noise figure measurement.
- Walk through a project. Expect detailed questions on why specific components and values were chosen, and how measurement compared with simulation.
How to Prepare
Practise the calculations above until they take under a minute, with decibel conversions done mentally. Be ready to draw a receiver and transmitter block diagram and to explain where each specification comes from. Work through the RF design learning roadmap for any gaps, review a textbook from the best RF design books list, and keep the wireless terms glossary nearby for vocabulary.
Frequently Asked Questions
What questions are asked in an RF interview?
Most technical rounds cover return loss and VSWR, the Smith chart, noise figure and cascades, sensitivity, P1dB and IP3, PLLs and phase noise, and receiver architecture. Many include short calculations and a discussion of a past project.
Do RF interviews include calculations?
Usually, yes. Expect decibel conversions, a Friis cascade, an IM3 level or a sensitivity estimate, worked by hand. Interviewers often care more about the method and the sanity checks than the exact last digit.
What should a new graduate focus on?
Decibels, transmission lines, the Smith chart, S-parameters, noise figure and linearity, plus one hands-on project with measured results. Depth on a few fundamentals is more convincing than shallow familiarity with many topics.
How are RFIC interviews different?
RFIC roles add transistor-level questions: LNA input matching with inductive degeneration, mixer and VCO topologies, on-chip passives and layout parasitics. The RFIC design introduction outlines that ground.
Related Topics
The Radio Architectures series is a good end-to-end refresher before a systems interview. For component questions, see low-noise amplifier design and power amplifier classes, and for system budgets, the RF link budget.