

Cascaded noise figure is the overall noise figure of a chain of stages, and it is calculated with the Friis formula: convert each stage’s noise figure and gain to linear ratios, add the first stage’s noise factor to each later stage’s excess noise factor divided by the total gain ahead of it, then convert the sum back to decibels. Because each later term is divided by the preceding gain, the first stage dominates the result.
The calculation explains one of the basic rules of receiver design: put a low-noise, high-gain amplifier as close to the antenna as possible and keep loss ahead of it to a minimum. This page gives the formula, a step-by-step method, a worked antenna-to-IF example, the mast-mounted LNA case and a calculator that also cascades IP3. It is part of the noise in RF systems section and assumes familiarity with noise figure and noise factor.
The Friis Formula for Noise Factor
For n stages with noise factors F1 … Fn and available power gains G1 … Gn, all as linear ratios, the total noise factor is
Ftotal = F1 + (F2 − 1)/G1 + (F3 − 1)/(G1G2) + … + (Fn − 1)/(G1G2 … Gn−1)
Harald Friis published this result in 1944. Each term after the first is the noise a stage adds, referred back to the system input by dividing by all the gain in front of it. The same equation in noise temperature is simpler still: Te,total = T1 + T2/G1 + T3/(G1G2) + …, with T = (F − 1) × 290 K, as described on the noise temperature page.
The formula assumes that each stage’s noise figure and gain are specified for the impedance it actually sees, normally 50 Ω, and that the noise bandwidth is the same throughout or is set by the last stage. Lossy passive stages have F = L and G = 1/L, as explained in the noise figure article.
How to Calculate Cascaded Noise Figure, Step by Step
- List the stages in signal order, from the antenna connector to the point where the noise bandwidth is set.
- For each stage note gain and noise figure in dB. For passive parts, gain is minus the loss and NF equals the loss.
- Convert both to linear ratios: F = 10NF/10 and G = 10GdB/10.
- Start the running total with F1 and set the running gain to G1.
- For each later stage, add (Fk − 1) divided by the running gain, then multiply the running gain by Gk.
- Convert the final total to dB: NFtotal = 10 log10(Ftotal). Keep the per-stage terms, because they show which stage to improve.
Worked Example: Antenna, Cable, LNA, Filter, Mixer
A receiver has its LNA at the equipment end of a feeder cable. The chain from antenna to IF is shown below; the values are illustrative rather than taken from any particular product.
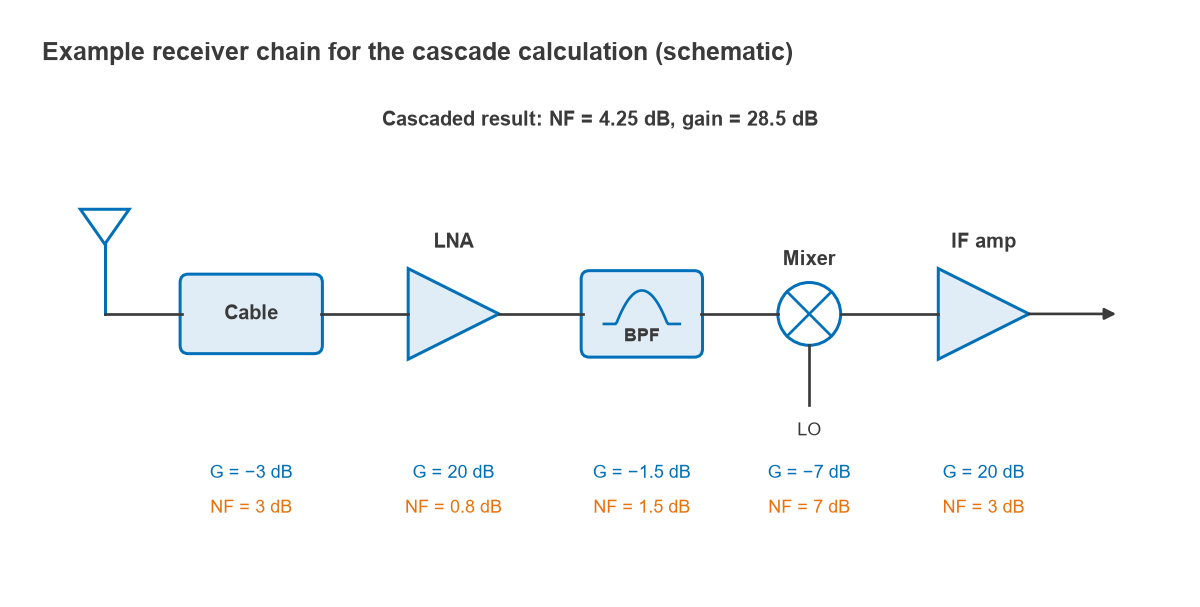
| Stage | Gain (dB) | NF (dB) | F (linear) | Gain ahead (linear) | Contribution to Ftotal | Cumulative NF (dB) |
|---|---|---|---|---|---|---|
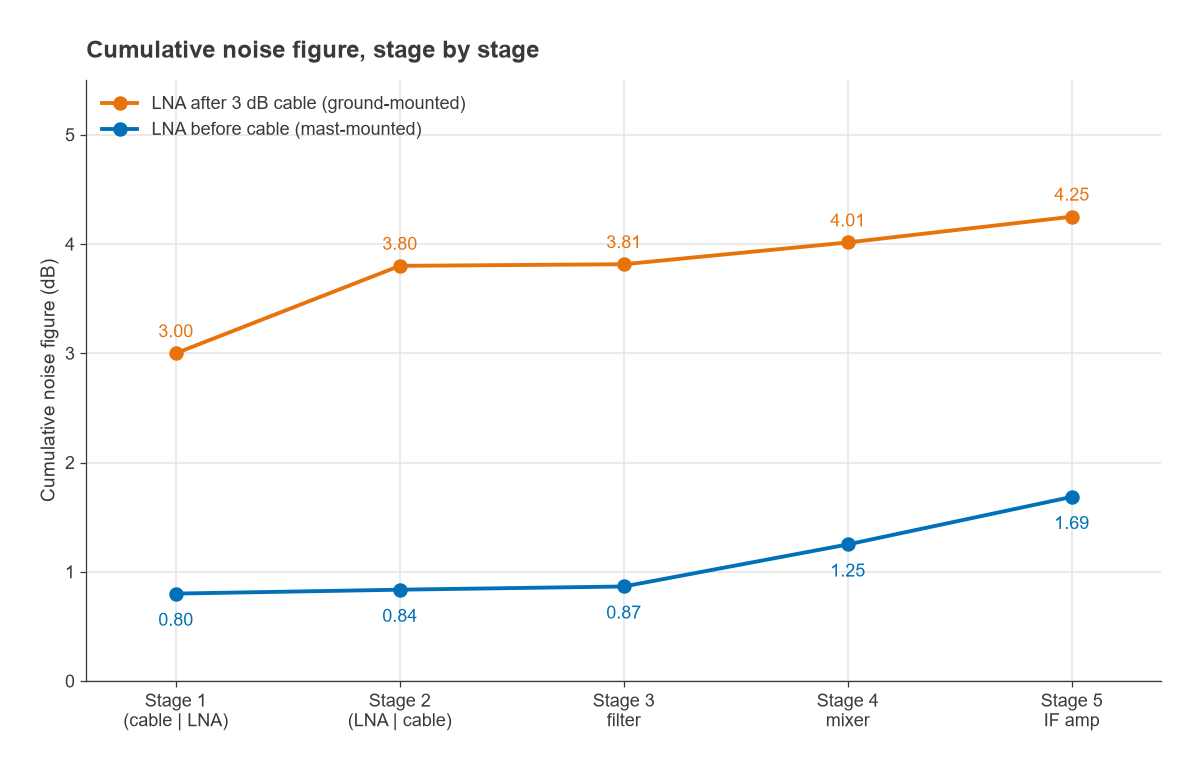
| 1. Cable | −3.0 | 3.0 | 1.995 | – | 1.9953 | 3.00 |
| 2. LNA | 20.0 | 0.8 | 1.202 | 0.501 | 0.4036 | 3.80 |
| 3. Bandpass filter | −1.5 | 1.5 | 1.413 | 50.1 | 0.0082 | 3.81 |
| 4. Mixer | −7.0 | 7.0 | 5.012 | 35.5 | 0.1131 | 4.01 |
| 5. IF amplifier | 20.0 | 3.0 | 1.995 | 7.08 | 0.1406 | 4.25 |
The total noise factor is 1.9953 + 0.4036 + 0.0082 + 0.1131 + 0.1406 = 2.661, so NFtotal = 10 log(2.661) = 4.25 dB and the total gain is 28.5 dB. Several points stand out:
- The 3 dB cable sets 3.00 dB of the 4.25 dB before the LNA is even reached. Loss ahead of the first gain stage adds to the noise figure decibel for decibel.
- The LNA’s 0.8 dB noise figure has become a 0.40 contribution, double its own excess noise of 0.20, because the cable’s loss is in front of it.
- After 20 dB of LNA gain, the filter’s 1.5 dB is almost invisible.
- The mixer and IF amplifier still contribute about 0.25 of noise factor together, because by the time the signal reaches the IF amplifier the net gain ahead of it has fallen to 8.5 dB. Losses after the LNA steadily erode its protection.
Why the LNA Should Be First
If the first stage has gain G1, everything behind it is divided by G1. With an LNA of 0.8 dB noise figure followed by a chain whose own noise figure is 10 dB, the system noise figure is 3.23 dB with 10 dB of LNA gain, 1.11 dB with 20 dB, and 0.90 dB with 25 dB. More gain helps, with diminishing returns, but it also raises every signal and interferer that reaches the following stages and so costs linearity. The usual design target is just enough LNA gain to make the second-stage term small, typically a few tenths of a decibel.
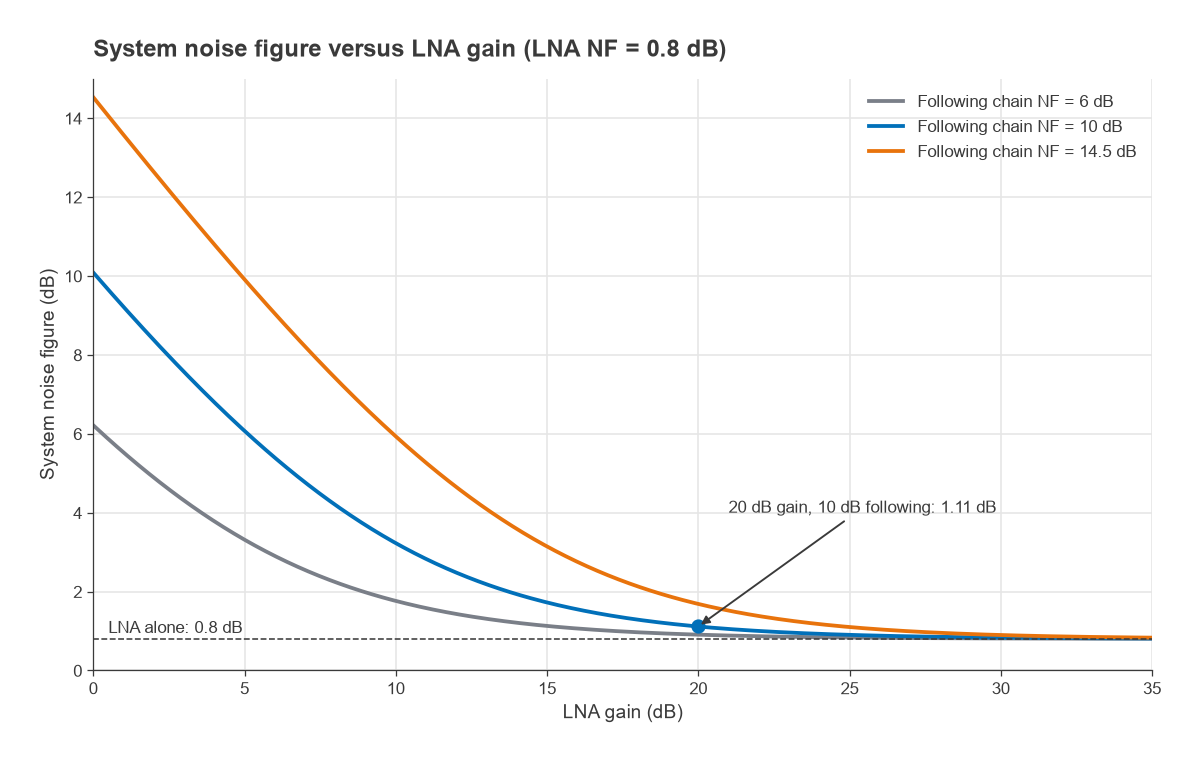
The same chain without an LNA has a noise figure of 14.5 dB, more than 10 dB worse than the 4.25 dB above. In a receiver whose noise bandwidth is 1 MHz, that is the difference between a noise floor of −109.7 dBm and −99.5 dBm. Turning a noise floor into a sensitivity number is covered in Radio Architectures Part 4, and the role of the low noise amplifier is explored in its own article.
How Cable Loss Before the LNA Affects Noise Figure
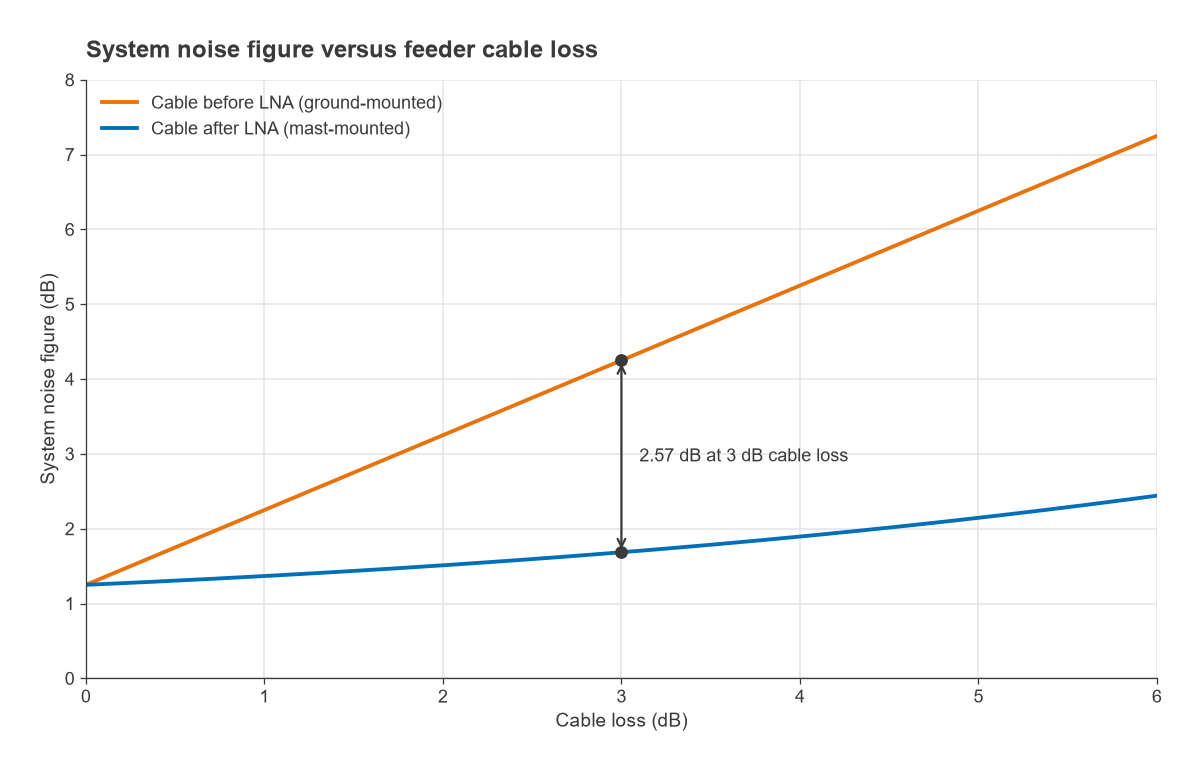
A lossy cable ahead of the LNA hurts twice. Its own noise figure equals its loss at room temperature, and its loss also reduces the gain that shields the later stages, so the LNA’s excess noise is multiplied by the loss. With the example chain, every decibel of feeder loss adds very nearly a decibel to the system noise figure, from 1.25 dB with no cable to 7.25 dB with 6 dB of cable.
The mast-mounted LNA case
Moving the LNA to the top of the mast, ahead of the cable, changes the order of the first two stages and nothing else. Recomputing with the order LNA, cable, filter, mixer, IF amplifier gives:
- LNA: F1 = 1.2023.
- Cable: (1.9953 − 1)/100 = 0.0100.
- Filter: 0.0082, mixer: 0.1131, IF amplifier: 0.1406 (unchanged, since the gain ahead of these stages is the same).
- Ftotal = 1.474, so NFtotal = 1.69 dB.
The mast-mounted arrangement is 2.57 dB better with identical parts. The advantage grows with feeder loss: with 6 dB of cable the mast-mounted system is still at 2.44 dB. This is the reason for tower-mounted amplifiers at cellular sites, LNBs at the focus of satellite dishes and active GNSS antennas. The cost is that the LNA must be powered, usually through the coax, and must survive the outdoor environment and nearby strong signals.
The same logic applies inside equipment. A switch, a diplexer or a long PCB trace ahead of the LNA counts in full. Filters needed for blocking protection are often placed ahead of the LNA anyway, and the designer accepts their loss as a direct noise-figure penalty in exchange for linearity. The RF link budget article shows how those decibels propagate into range.
Cascading IP3 Alongside Noise Figure
Gain placed early lowers noise figure but makes later stages see bigger signals. The input-referred third-order intercept of a cascade, in linear power units, follows a reciprocal sum that weights later stages by the gain in front of them:
1/IIP3total = 1/IIP31 + G1/IIP32 + G1G2/IIP33 + …
This simple form assumes the distortion products add in phase, which gives the worst case. Using IIP3 values of +5 dBm for the LNA, +15 dBm for the mixer and +10 dBm for the IF amplifier, and treating the cable and filter as perfectly linear, the ground-mounted chain has IIP3total = −2.99 dBm and the mast-mounted chain −3.32 dBm. Here the mixer and IF amplifier dominate, so swapping the LNA and cable costs only 0.33 dB of intercept while gaining 2.57 dB of noise figure. That will not always be true, and the cascaded IP3 article covers the linearity side in more depth.
Cascaded Noise Figure and IP3 Calculator
The calculator is pre-loaded with the ground-mounted example. Leave IIP3 blank for stages that can be treated as linear, such as cables and passive filters. Set a stage’s gain to blank to exclude it.
| Stage | Gain (dB) | NF (dB) | IIP3 (dBm, optional) |
|---|
Common Mistakes
- Adding noise figures in dB. The formula works only with linear noise factors and gains.
- Using F instead of F − 1 for the later stages, which double-counts the source noise.
- Forgetting that a lossy part’s noise figure equals its loss only at 290 K. A heated cable is slightly worse, a cooled one better.
- Mixing a DSB mixer noise figure into a chain that needs the SSB value, which flatters the result by about 3 dB at that stage.
- Ignoring mismatch. Gain and noise figure from a datasheet apply in a 50 Ω system; a filter with poor return loss next to an LNA can shift both.
Frequently Asked Questions
How do you calculate cascaded noise figure?
Convert every stage’s noise figure and gain to linear ratios, then apply Ftotal = F1 + (F2 − 1)/G1 + (F3 − 1)/(G1G2) + …. Convert the result back with 10 log Ftotal. The calculator on this page does this and also reports cumulative gain and IIP3.
Why should the LNA be first?
Each later stage’s noise is divided by the gain ahead of it, so a high-gain, low-noise first stage makes the rest of the chain nearly irrelevant to noise figure. Any loss placed before the LNA adds directly to the system noise figure. In the example above, the LNA alone turned a 14.5 dB chain into one of a few decibels.
How does cable loss before the LNA affect noise figure?
At room temperature it adds almost decibel for decibel, because a lossy cable’s noise figure equals its loss and it reduces the gain that protects later stages. In the worked example, 3 dB of cable ahead of the LNA gave 4.25 dB system noise figure, against 1.69 dB with the LNA at the antenna.
Related Topics
The inputs to this calculation are explained in noise figure and thermal noise and kTB. For component choices, see how to choose an LNA and how to choose a broadband RF amplifier. The RF design overview links the noise, linearity and architecture topics together.