

Noise figure (NF) is a measure of how much a component or system degrades the signal-to-noise ratio of a signal passing through it, expressed in decibels. It is 10 log10 of the noise factor F, the ratio of input SNR to output SNR when the source is at the reference temperature of 290 K. An ideal noiseless device has F = 1 and NF = 0 dB, and every real amplifier, mixer, cable or filter has a noise figure above zero.
Noise figure is the single most important number in receiver design, because together with bandwidth it sets the noise floor and therefore the sensitivity. This page defines noise factor and noise figure, links them to noise temperature, explains why a passive lossy part has a noise figure equal to its loss, and gives approximate values for common device types. It is part of the noise in RF systems section and builds on thermal noise and kTB.
Noise Factor and Noise Figure Defined
Consider a two-port with available power gain G, driven by a matched source whose noise is kT0B with T0 = 290 K. The noise factor is
F = SNRin / SNRout = Nout / (G · kT0B)
The second form shows what F means physically: the total output noise divided by the part of the output noise that came from the source. If the device added nothing, the output noise would be exactly G · kT0B and F would equal 1. Noise figure is the same quantity in decibels:
NF = 10 log10(F) dB
The terms are often used interchangeably, but strictly noise factor is the linear ratio and noise figure is the decibel value. Cascade calculations must be done with the linear noise factor; only the final answer is converted to decibels.
Worked example: SNR through an amplifier
A −90 dBm signal arrives in a 1 MHz noise bandwidth from a 290 K source. The amplifier has 15 dB gain and NF = 2 dB.
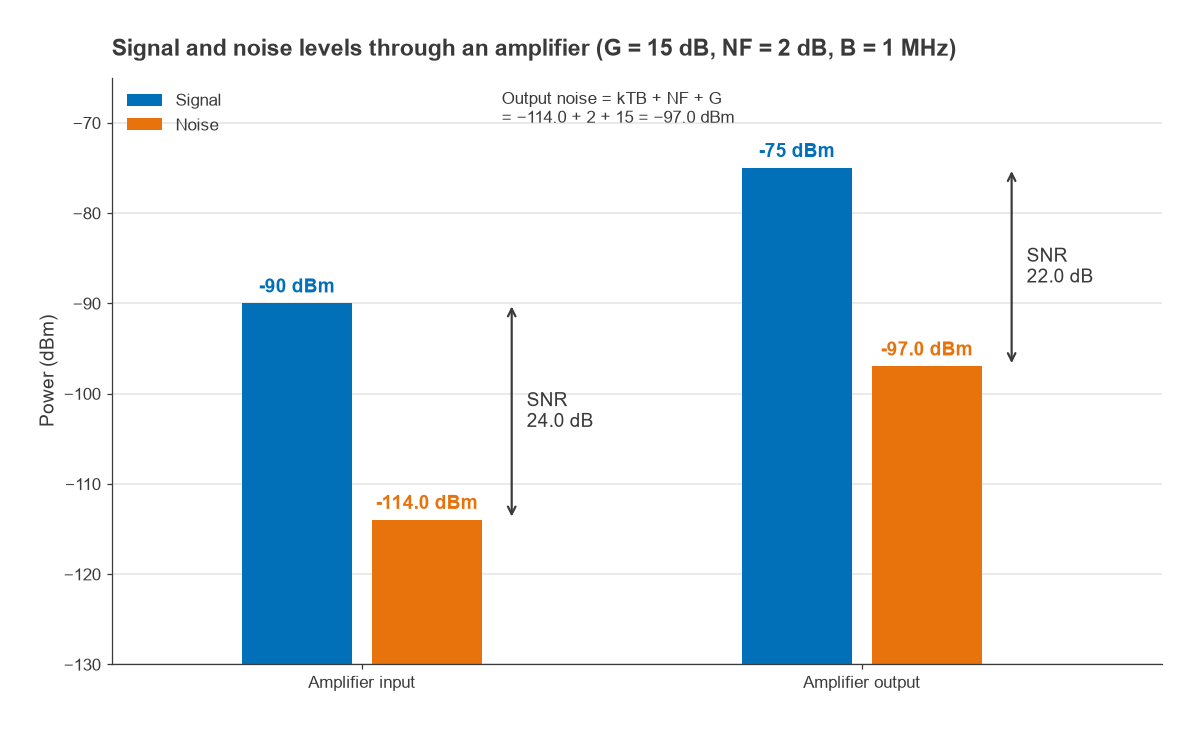
- Input noise: kTB = −174.0 + 60.0 = −114.0 dBm, so SNRin = 24.0 dB.
- Output signal: −90 + 15 = −75 dBm.
- Output noise: −114.0 + 2 + 15 = −97.0 dBm.
- SNRout = −75 − (−97.0) = 22.0 dB, which is 2 dB less than SNRin, exactly the noise figure.
The noise the amplifier adds, referred to its input, is (F − 1)kT0B. With F = 100.2 = 1.585 that is 0.585 × kT0B, or −116.3 dBm in 1 MHz. Gain does not appear in the SNR result: the amplifier raises signal and noise together and adds a little noise of its own.
Why the 290 K Reference Matters
The statement “NF equals the SNR degradation” is only true when the source noise temperature is 290 K. Noise figure is a property of the device, defined against a standard source, not of the system it is placed in. When the source is colder, as with an antenna pointed at clear sky, the same device degrades SNR by more than its noise figure suggests.
Take an LNA with NF = 0.5 dB connected to an antenna whose noise temperature is 50 K. The LNA’s own noise temperature (next section) is 35.4 K. The SNR degradation is (TA + Te) / TA = 85.4 / 50 = 1.71, or 2.32 dB. For this reason low-noise satellite and radio astronomy receivers are specified and compared by noise temperature, where the arithmetic stays linear and honest.
Noise Figure and Noise Temperature
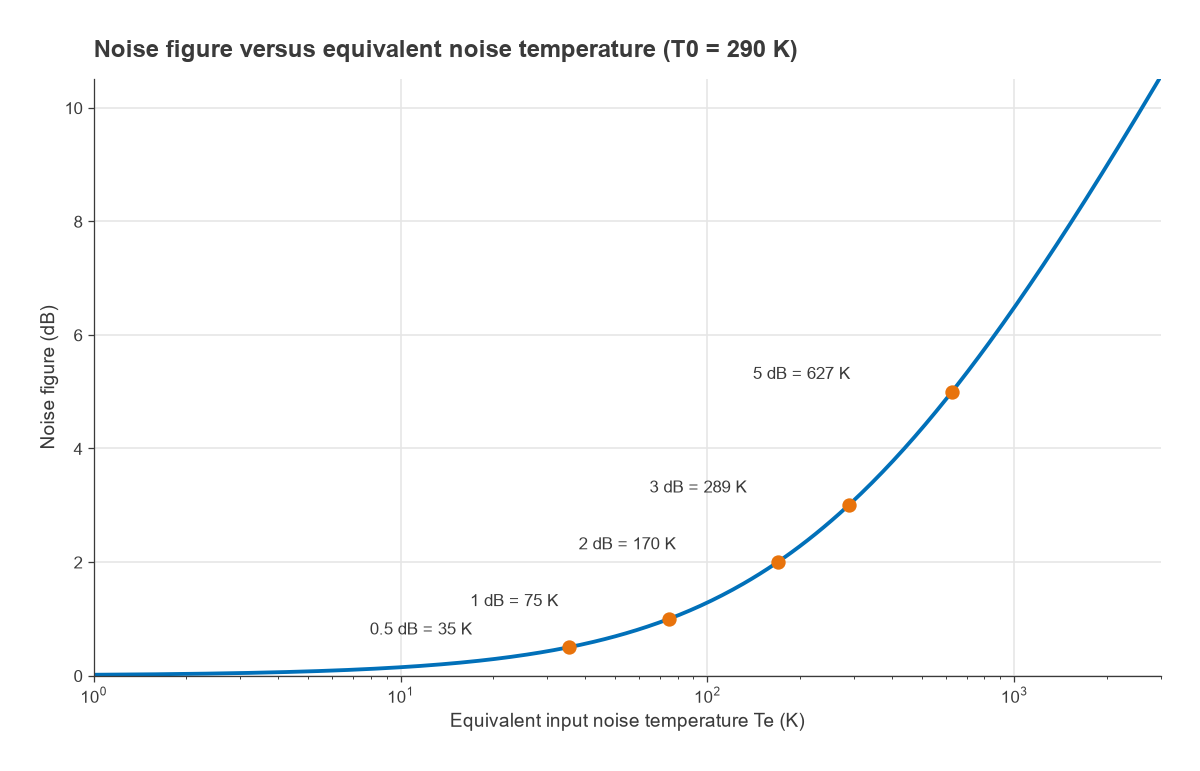
A noisy two-port can be replaced by a noiseless one with an extra resistor at its input, at an equivalent temperature Te, that produces the same added output noise. The relationship to noise factor is
Te = (F − 1) T0 and F = 1 + Te / T0
| NF (dB) | Noise factor F | Te (K) |
|---|---|---|
| 0.3 | 1.072 | 20.7 |
| 0.5 | 1.122 | 35.4 |
| 1.0 | 1.259 | 75.1 |
| 2.0 | 1.585 | 169.6 |
| 3.0 | 1.995 | 288.6 |
| 5.0 | 3.162 | 627.1 |
| 10.0 | 10.000 | 2610.0 |
Near 0 dB the noise figure scale compresses detail. The step from 0.3 dB to 0.5 dB looks trivial but is a 70 % increase in added noise, from 20.7 K to 35.4 K. A 3 dB noise figure means the device adds as much noise as a 290 K source supplies, which halves the SNR. More detail is on the noise temperature and antenna temperature page.
Noise Figure of Passive and Lossy Components
A matched attenuator, cable or filter with loss L (a linear ratio greater than 1) at physical temperature T has
Te = (L − 1) T and F = 1 + (L − 1) T / T0
At T = T0 = 290 K this reduces to F = L: the noise figure in decibels equals the loss in decibels. The reasoning is simple. The output of a matched lossy network at 290 K is itself a 290 K resistive source, so its output noise is kT0B regardless of the loss. The signal, meanwhile, has been attenuated by L. SNR therefore falls by exactly L.
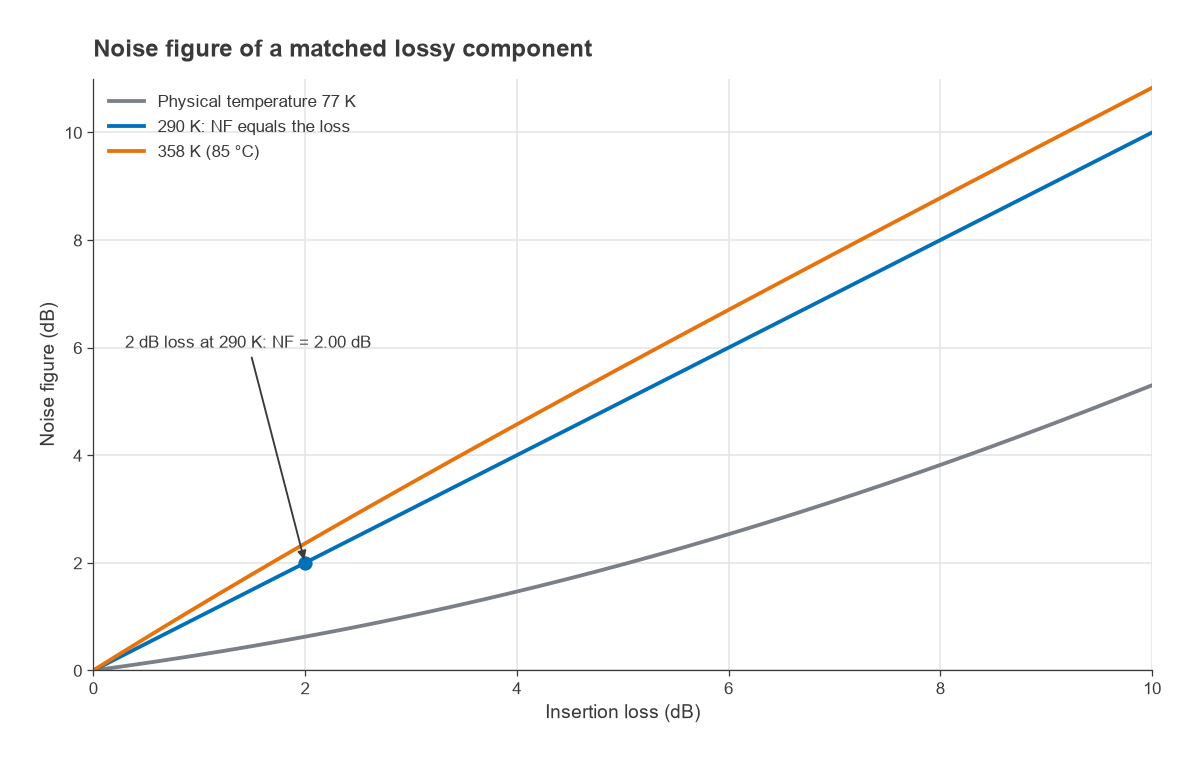
A 2 dB cable at 290 K has NF = 2.00 dB. Heated to 85 °C (358 K) the same cable has NF = 2.22 dB, and cooled to 77 K it has NF = 0.63 dB. This is why the input filter and any cable ahead of the LNA are counted in full against the receiver’s noise figure, and why cryogenic receivers cool the input components as well as the amplifier.
Mixers are a special case. A passive diode or FET mixer behaves much like a lossy network, so its single-sideband noise figure is roughly equal to its conversion loss plus a small excess. Mixer noise figures are quoted either as SSB or DSB, and the DSB figure is normally about 3 dB lower because it assumes signal in both sidebands. Comparing a DSB number with an SSB requirement is a common error.
Typical Noise Figure Values by Device Type
The ranges below are approximate and indicative only, for parts operating at frequencies up to a few gigahertz. Noise figure generally rises with frequency, and individual parts can fall outside these bands, so the datasheet at the actual frequency, bias and source impedance is the only reliable figure.
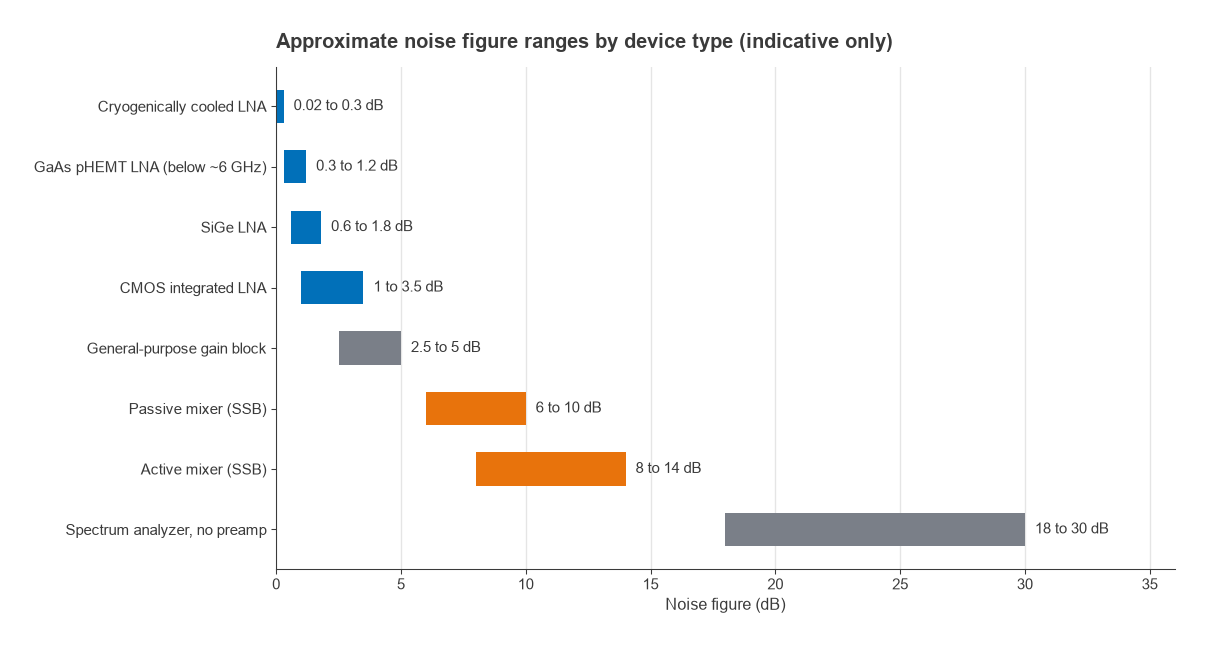
- Cryogenically cooled LNAs: well below 0.3 dB, usually stated as noise temperature in kelvin.
- GaAs pHEMT LNAs: roughly 0.3 to 1.2 dB below about 6 GHz.
- SiGe LNAs: roughly 0.6 to 1.8 dB.
- CMOS LNAs integrated in transceivers: roughly 1 to 3.5 dB.
- General-purpose gain blocks: roughly 2.5 to 5 dB, traded for broad bandwidth and simple matching.
- Mixers: passive types about 6 to 10 dB SSB, active types often higher.
- Spectrum analyzers without a preamplifier: commonly in the high teens to around 30 dB, which is why a preamp or external LNA is used for low-level noise work.
A “good” LNA noise figure is therefore relative to the application. For a terrestrial receiver whose antenna sees roughly 290 K, cutting the LNA noise figure from 1.0 dB to 0.5 dB improves sensitivity by at most 0.5 dB, and by less once the noise of the later stages is included. For a satellite ground terminal looking at a cold sky the same change can be worth much more. The guide to choosing an LNA covers how noise figure trades against gain, linearity and power, and LNA design covers how it is achieved.
From Noise Figure to Receiver Performance
Noise figure enters receiver design in two ways. First, the noise floor referred to the input is −174 + 10 log B + NF dBm, and adding the required SNR gives the receiver sensitivity. Second, the noise figure of a chain of stages is found with the Friis cascade formula, which shows that the first stage dominates when its gain is high. Measuring it is usually done with the Y-factor method, described on the noise figure measurement page.
Noise figure also depends on the source impedance presented to the device. Every transistor has an optimum source reflection coefficient for minimum noise, Γopt, which is generally not the conjugate match for maximum gain. LNA design is largely the art of choosing a compromise between the two, and wideband amplifiers often accept a higher noise figure in exchange for a flat 50 Ω match. The broadband amplifier selection guide discusses that trade.
Frequently Asked Questions
What is noise figure?
Noise figure is the ratio, in decibels, of input SNR to output SNR for a device driven by a 290 K source. It tells you how much noise the device adds relative to the thermal noise already present. Lower is better, and 0 dB is the theoretical ideal.
What is the difference between noise factor and noise figure?
Noise factor F is the linear ratio, and noise figure is 10 log F in decibels. A noise factor of 2 is a noise figure of 3.01 dB. Use F in cascade calculations and convert to NF at the end.
What is a good noise figure for an LNA?
For general wireless receivers at a few gigahertz, LNA noise figures of roughly 0.5 to 1.5 dB are common targets. Satellite and radio astronomy front ends aim much lower and are usually specified in kelvin. The value that matters is the cascaded figure of the whole receiver, so a very low LNA figure is wasted if a lossy filter sits in front of it.
Can noise figure be negative?
Not for a real two-port measured as defined, because no device can remove noise that is already present in the source, so F cannot fall below 1. Small negative readings appear in practice from measurement uncertainty, mismatch or an incorrect ENR table. Cooling a device lowers its noise figure towards 0 dB but never below it.
Related Topics
See thermal noise and the −174 dBm/Hz floor, cascaded noise figure and noise temperature in this section, and the RF design overview for how noise fits with linearity and matching.