

RF test and measurement is the practice of characterizing radio-frequency circuits and systems with calibrated instruments, so that gain, match, noise, linearity and spectral purity can be checked against the design. A basic RF lab needs a vector network analyzer, a spectrum analyzer, at least one signal generator and a power meter, with noise figure and phase noise measurement added as the work demands.
Every number on an RF datasheet or in a link budget was measured by one of these instruments, and each instrument has its own error sources. Knowing which tool answers which question, and what limits its accuracy, is as much a part of RF design as the circuit work itself. This hub introduces the main instruments and links to the detailed pages on each.
The Core Instruments
Vector network analyzer
A vector network analyzer (VNA) sends a known stimulus into a device and measures the reflected and transmitted waves in magnitude and phase. The result is a set of S-parameters, from which gain, return loss, VSWR, group delay and input impedance all follow. It is the main tool for filters, matching networks, amplifiers in small-signal operation, cables and antennas. Its accuracy depends almost entirely on calibration.
Spectrum analyzer
A spectrum analyzer displays power against frequency. It is the tool for harmonics, spurious outputs, intermodulation products, ACLR, occupied bandwidth and, with the right options, modulation quality and phase noise. Its key settings are resolution bandwidth, video bandwidth, reference level and input attenuation, which together set the displayed noise floor and the analyzer’s own distortion.
Signal generator
A signal generator provides the stimulus: a clean continuous-wave tone for gain, compression and intermodulation tests, or a modulated signal for receiver sensitivity and transmitter linearity. Its own phase noise, harmonics and level accuracy must be better than the quantity being measured, or the test measures the generator instead of the device.
Power meter and sensor
A power meter with a thermal or diode sensor gives the most accurate absolute power reading on the bench. It is used to set generator levels, calibrate spectrum analyzer readings and measure transmitter output. Average-power sensors are simple to use; peak and envelope sensors are needed for pulsed and high crest-factor signals.
Noise figure and phase noise analyzers
Low-noise amplifiers and receivers need a noise figure measurement, usually by the Y-factor method with a calibrated noise source, either on a dedicated analyzer or as an option on a spectrum analyzer or VNA. Oscillators and synthesizers need a phase noise measurement, which a dedicated analyzer makes with much lower noise floor than a spectrum analyzer alone.
Matching the Instrument to the Measurement
Several parameters can be measured on more than one instrument, but usually one does it best. A VNA gives gain and match faster and more accurately than a generator and spectrum analyzer, while a spectrum analyzer sees spurs that a VNA’s narrow receiver would never show. The table summarizes the usual pairing.
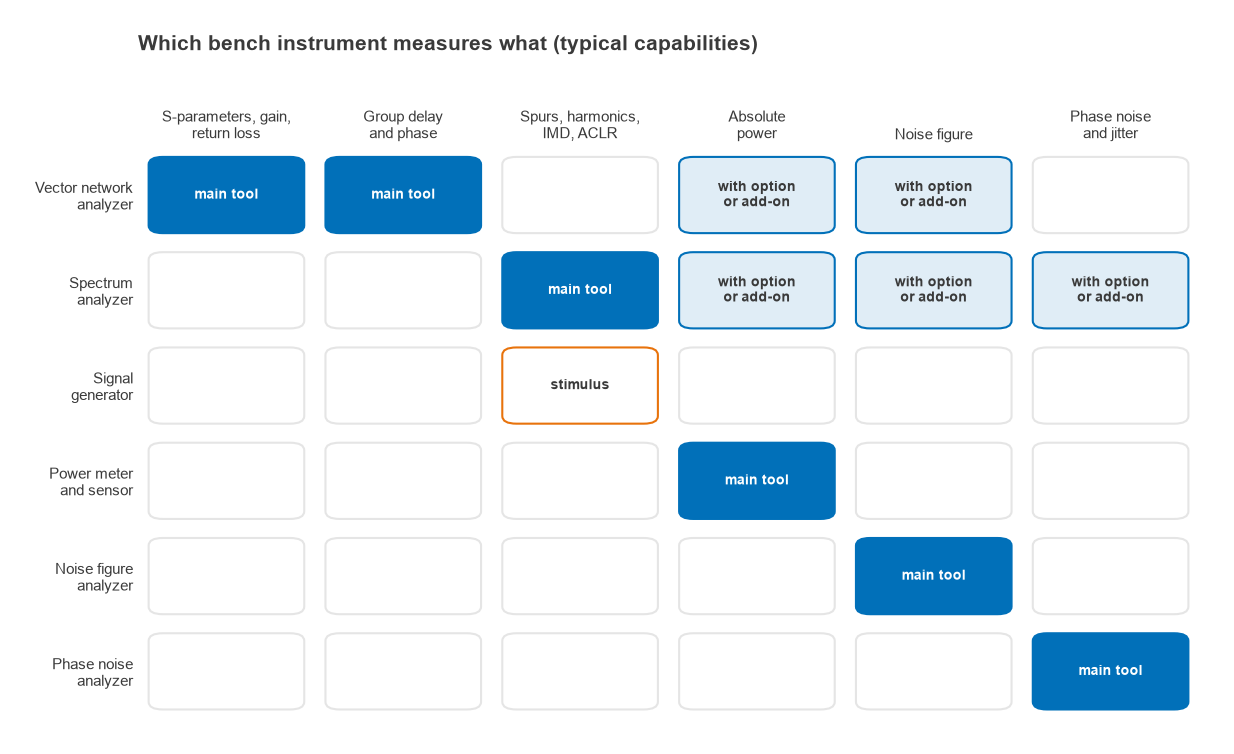
| Quantity | Usual instrument | Main accuracy limit |
|---|---|---|
| S-parameters, return loss, gain | VNA | Calibration quality, cable stability |
| Harmonics, spurs, IMD, ACLR | Signal generator and spectrum analyzer | Analyzer noise floor and internal distortion |
| Absolute power | Power meter and sensor | Sensor mismatch and calibration factor |
| Compression (P1dB) | VNA power sweep, or generator and power meter | Source level accuracy, receiver compression |
| Noise figure | Noise figure analyzer or option | Noise source ENR, mismatch, second-stage noise |
| Phase noise | Phase noise analyzer, or spectrum analyzer for moderate levels | Instrument’s own phase noise floor |
Good Measurement Practice
Most bad RF measurements come from the setup rather than the instrument. A few habits prevent the common ones:
- Calibrate at the reference plane where the device actually connects, not at the instrument front panel.
- Use a torque wrench, keep connectors clean, and do not flex test cables between calibration and measurement.
- Put attenuators where they improve match or protect an input, and account for their loss.
- Check that the result comes from the device and not the instrument: change the attenuation or level by a known step and confirm the reading moves as expected.
- Record instrument settings with every result, so the measurement can be repeated.
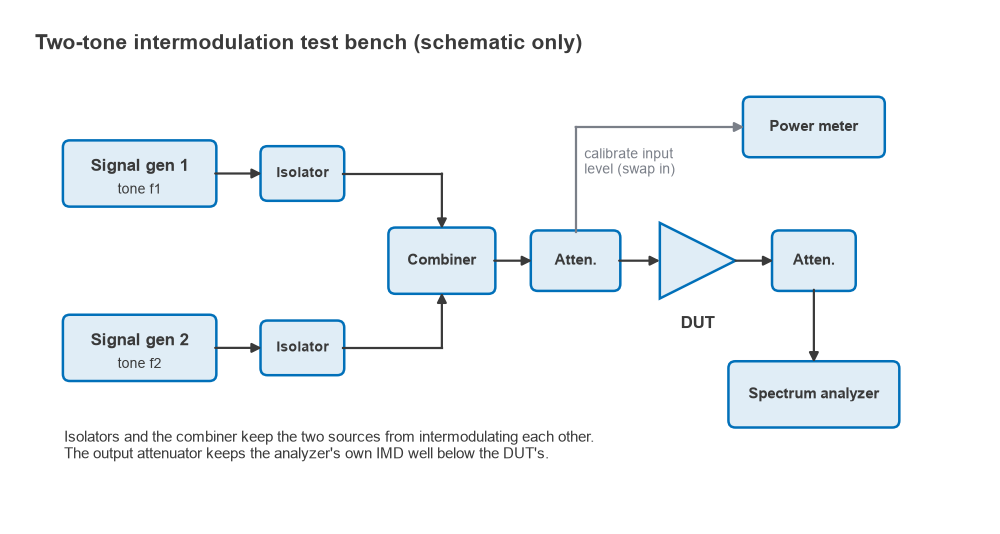
A two-tone intermodulation test shows several of these ideas at once. Two generators are isolated and combined so they do not intermodulate each other, the input level is set with a power meter, and an attenuator ahead of the spectrum analyzer keeps its mixer well below its own compression. If the third-order products change by 3 dB for each 1 dB change in input level, they come from the device; if they do not, they are likely produced by the setup. The theory is covered in RF linearity.
Pages in This Section
- Vector network analyzer (VNA) basics: block diagram, IF bandwidth, dynamic range and low-cost VNA limits.
- VNA calibration: SOLT, TRL and error terms: how calibration removes systematic errors.
- Spectrum analyzer basics: RBW, VBW, DANL: settings, noise floor and analyzer distortion.
- How to measure noise figure: the Y-factor and cold-source methods.
- Phase noise measurement: spectrum analyzer and dedicated analyzer methods.
- Measuring amplitude and power in RF signals: power meters, sensors and level measurement.
- RF testing and troubleshooting tips: a practical checklist for when a board does not perform.
For system-level tests such as sensitivity, EVM and spectral masks on a complete radio, see Radio Architectures Part 20: Measuring Radio Performance, which builds on receiver sensitivity and the link budget.
Frequently asked questions
What equipment does an RF lab need?
The core set is a vector network analyzer, a spectrum analyzer, a signal generator and a power meter, plus quality cables, adapters, attenuators and a calibration kit. Noise figure and phase noise capability are added for receiver and oscillator work, often as options on the analyzers already on the bench.
Can one instrument do everything?
Some modern analyzers combine network analysis, spectrum analysis and source functions, and they cover many tasks well. Dedicated instruments still tend to win on the extremes: the lowest noise floor, the best phase noise, or the most accurate absolute power.
Why do my measurements change from day to day?
The usual causes are cable movement after calibration, worn or dirty connectors, temperature drift, and calibrations that have aged. Re-checking a known reference device, such as a through line or an attenuator, at the start of each session catches most of these.
Related topics
Measured S-parameters are usually saved as Touchstone files and may need de-embedding to remove fixtures. Impedance results are often read on a Smith chart. Definitions of terms used across this section are in the wireless terms glossary.