

Noise figure measurement is the process of determining how much noise a device adds to a signal, by comparing its output noise for two known input noise levels or by measuring its absolute output noise and gain. The Y-factor method switches a calibrated noise source between hot and cold states, measures the ratio Y = Nhot/Ncold, and computes F = ENR/(Y − 1), then removes the analyzer’s own contribution with a second-stage correction.
Noise figure is one of the hardest RF parameters to measure well, because the signals involved are tiny and every cable, adapter and mismatch matters. This page covers the Y-factor method in detail, the cold-source alternative, a practical spectrum-analyzer approach, and the main sources of error, with a full worked example. It belongs to the RF measurement hub of the RF design reference. The quantity being measured is defined on the noise figure page.
What is ENR?
A noise source is usually an avalanche diode followed by an attenuator that improves its match. With its bias off it presents a cold noise temperature, close to room temperature. With its bias on (commonly 28 V) it presents a much higher hot noise temperature. The excess noise ratio describes the difference relative to the standard temperature T0 = 290 K:
ENR = (Thot − T0)/T0, usually quoted in dB as 10 log10(ENR)
A source with an ENR of 15 dB has Thot = 290 × (31.6 + 1) = 9,461 K. ENR varies with frequency, so each source comes with a calibration table that the analyzer interpolates. Sources are commonly offered with high ENR (around 15 dB) and low ENR (around 5 to 6 dB) versions; the trade-off between them is discussed below. The link between noise temperature and noise figure is set out in noise temperature.
The Y-factor method
The output noise power of a device with gain G, bandwidth B and effective input noise temperature Te, driven by a source at temperature Ts, is N = kBG(Ts + Te). Measuring at two source temperatures and taking the ratio cancels k, B and G:
Y = Nhot/Ncold = (Thot + Te)/(Tcold + Te), so Te = (Thot − Y Tcold)/(Y − 1)
When Tcold = T0, this reduces to the familiar form:
F = ENR/(Y − 1), and NF = 10 log10(F)
If the cold temperature differs from 290 K, the general form F = [ENR − Y(Tcold/T0 − 1)]/(Y − 1) applies. Most analyzers read a temperature sensor on the noise source and apply it automatically. Ignoring it matters: in the example below, a source at 300 K treated as 290 K makes a 1.91 dB system read 2.01 dB.
Second-stage correction
The analyzer that measures the noise powers has its own noise figure F2, often 10 dB or more without a preamplifier. The quantity measured with the DUT in place is the cascade F12, which by the Friis formula is F12 = F1 + (F2 − 1)/G1. The DUT’s own noise figure follows by rearranging:
F1 = F12 − (F2 − 1)/G1
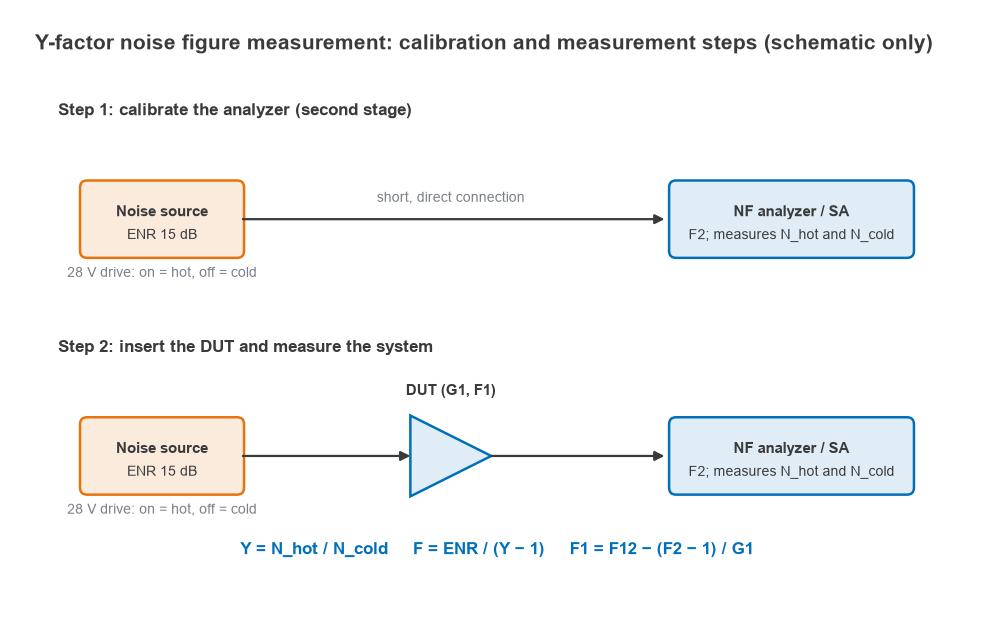
Both F2 and G1 come from the measurement itself. A calibration step with the noise source connected straight to the analyzer gives F2 and the analyzer’s hot and cold noise powers. With the DUT inserted, the change in hot-minus-cold noise power gives the DUT gain:
G1 = (Nhot,12 − Ncold,12)/(Nhot,2 − Ncold,2)
The correction becomes large, and its uncertainty grows, when the DUT gain is low or the analyzer noise figure is high. Adding a low-noise preamplifier in front of the analyzer, and including it in the calibration, reduces F2 and makes low-gain DUTs measurable.
How to measure noise figure: step by step
- Load the noise source’s ENR table into the analyzer and set the frequency list, measurement bandwidth and averaging.
- Calibrate: connect the noise source directly to the analyzer input (with any preamplifier that will be used) and run the calibration. The analyzer measures hot and cold noise and stores F2.
- Insert the DUT between the noise source and the analyzer, with DC bias applied and the device thermally settled.
- Measure. The analyzer reports corrected NF and gain at each frequency.
- Remove the effect of any adapters or cables between the source and the DUT input by entering their loss as input loss compensation. Loss before the DUT adds to its noise figure dB for dB.
- Check the result for plausibility: repeat with a different cable, rotate the noise source connection, and confirm that gain agrees with a VNA measurement.
Worked example: a 1.2 dB LNA
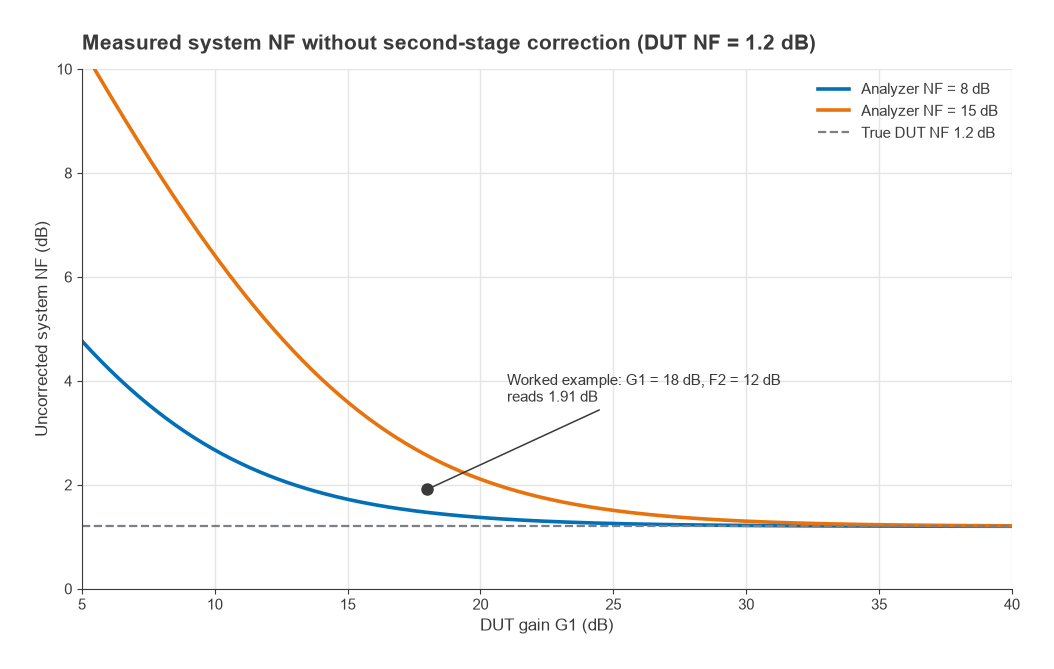
Consider an LNA with G1 = 18 dB and NF1 = 1.2 dB, measured with an analyzer whose noise figure is 12 dB, using a noise source with ENR = 15 dB (31.6 linear) and Tcold = 290 K.
Calibration step
The analyzer alone has Te2 = 290 × (15.85 − 1) = 4,306 K. Its measured Y-factor is Y2 = (9,461 + 4,306)/(290 + 4,306) = 2.995, or 4.76 dB. Then F2 = 31.6/(2.995 − 1) = 15.85, which recovers 12.0 dB.
Measurement step
The cascade noise factor is F12 = 1.318 + 14.85/63.1 = 1.554, or 1.91 dB, so the analyzer measures Y12 = 31.6/1.554 + 1 = 21.35, or 13.29 dB. The ratio of hot-minus-cold noise powers between the two steps returns G1 = 63.1 (18.0 dB). The correction is:
F1 = 1.554 − (15.85 − 1)/63.1 = 1.318, so NF1 = 1.20 dB
| Quantity | Value |
|---|---|
| Thot for ENR 15 dB | 9,461 K |
| Y, analyzer only | 4.76 dB, giving NF2 = 12.0 dB |
| Y, LNA plus analyzer | 13.29 dB, giving NF12 = 1.91 dB |
| Measured LNA gain | 18.0 dB |
| Corrected LNA noise figure | 1.20 dB (Te = 92 K) |
Without the second-stage correction the result would be 1.91 dB, an error of 0.71 dB. With 30 dB of DUT gain the same analyzer would add only about 0.05 dB, which is why high-gain amplifiers are easier to measure. Selection criteria for amplifiers judged on these numbers are covered in how to choose an LNA and how to choose a broadband RF amplifier.
Choosing the ENR
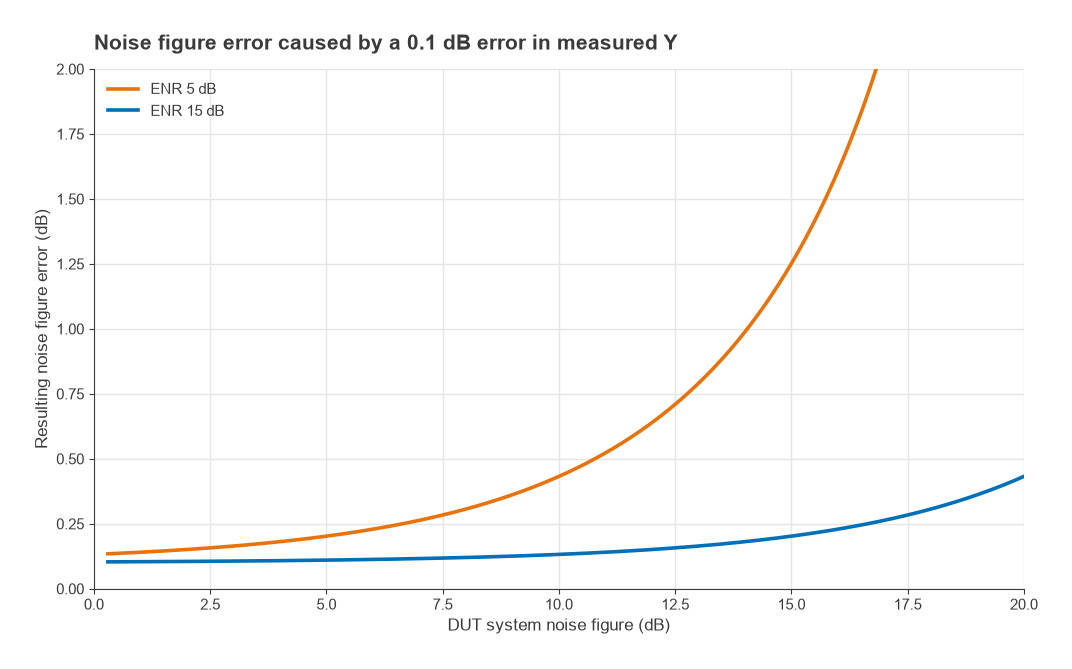
Noise figure is computed from a ratio, so any error in measuring Y propagates into NF. When the DUT noise figure approaches the ENR, Y approaches 1 and small errors in Y produce large errors in F. With ENR = 15 dB, a 0.1 dB error in Y produces about 0.10 dB of NF error for a 1 dB device and 0.13 dB at 10 dB. With ENR = 5 dB, the same Y error gives 0.14 dB at 1 dB but 0.43 dB at 10 dB and 1.25 dB at 15 dB.
Low-ENR sources still have a place. Their cold and hot impedances differ less, so the DUT sees a more constant source match between states, which helps when the DUT’s noise figure or gain depends strongly on source impedance. Low ENR also reduces the risk of driving a high-gain DUT or the analyzer’s input into compression during the hot state. A common rule is to use the lowest ENR that keeps Y comfortably above 1 for the expected noise figure.
The cold-source method
The cold-source (or gain) method uses only a cold termination at 290 K and measures the absolute output noise power density of the DUT, together with an accurate gain measurement, usually from a VNA. The noise factor follows from:
F = Nout/(kT0BG)
Because the measurement and gain come from a vector network analyzer with noise receivers, the instrument can apply full vector correction for mismatch at both ports, which removes the source match change that limits the Y-factor method. The receiver must be calibrated for absolute noise power, and the method needs accurate gain, but it handles mismatched, on-wafer and very low-noise devices well. Noise parameter extraction, where the DUT is measured at several source impedances, is usually built on this approach.
Spectrum analyzer method
When no noise figure analyzer or noise source is available, a spectrum analyzer can estimate noise figure for high-gain devices using the gain method. The DUT input is terminated in 50 Ω at room temperature, and the analyzer measures the output noise density with a noise marker, which corrects for resolution bandwidth shape and log averaging. Since kT0 = −174 dBm/Hz:
NF (dB) = Pn (dBm/Hz) + 174 − G (dB)
The spectrum analyzer’s own noise floor must be well below the DUT output noise, or it must be subtracted. For example, take a 30 dB gain amplifier whose output noise measures −141.5 dBm/Hz, with the analyzer showing −152.0 dBm/Hz when the DUT is removed and the input terminated. The uncorrected estimate is −141.5 + 174 − 30 = 2.5 dB. Subtracting the analyzer floor in linear units gives a DUT noise density of −141.9 dBm/Hz and NF ≈ 2.1 dB. A preamplifier in front of the analyzer lowers its floor and reduces the size of this correction. Analyzer settings and noise markers are covered in spectrum analyzer basics.
Sources of error
- ENR uncertainty. The noise source calibration is often the largest single contributor, typically quoted in the region of 0.1 to 0.2 dB.
- Mismatch. Reflections between source, DUT and analyzer change the delivered noise power and, through noise parameters, the DUT noise figure itself. An isolator at the DUT input can help in narrow bands.
- Interference. Mobile phones, Wi-Fi and switching supplies add signals that read as noise. Shielded rooms or screened enclosures help for low noise figures.
- Jitter. Noise readings fluctuate; averaging and wider measurement bandwidth reduce the spread.
- Nonlinearity. The DUT and analyzer must stay linear in the hot state across the whole noise bandwidth.
- Input loss. Any adapter loss before the DUT that is not compensated adds directly to the measured noise figure.
A careful measurement states its uncertainty, which is usually computed by combining these contributions. The wider measurement chain, including receiver sensitivity tests that depend on noise figure, is covered in measuring radio performance, and the effect of noise figure on sensitivity in receiver sensitivity.
Frequently asked questions
How do you measure noise figure?
The most common method is the Y-factor technique. Calibrate the analyzer with a noise source of known ENR, insert the device, and measure the ratio of output noise with the source on and off. The analyzer computes F = ENR/(Y − 1) and removes its own contribution with the second-stage correction.
What is ENR?
ENR, the excess noise ratio, describes how much hotter a noise source is in its on state than the 290 K reference: ENR = (Thot − T0)/T0. It is usually given in dB and varies with frequency, so each noise source has its own calibration table.
Can a spectrum analyzer measure noise figure?
Yes, for high-gain devices. Terminate the input, read the output noise density with a noise marker, and use NF = Pn + 174 − G. The analyzer’s own noise floor must be much lower than the DUT output noise, or subtracted.
Related topics
Background theory is on the noise figure, thermal noise kTB and cascaded noise figure pages, and the wider topic on the RF noise hub. Amplifier design for low noise is covered in design of low noise amplifiers, and calibration of the network analyzer used for gain in VNA calibration. Terms are defined in the wireless terms glossary.