

Phase noise measurement is the characterisation of the random phase fluctuations of an oscillator or synthesizer, reported as single-sideband phase noise L(f) in dBc/Hz against offset from the carrier. It is measured either directly on a spectrum analyzer, by comparing noise sideband power with carrier power, or with a phase detector that removes the carrier, often in a two-channel cross-correlation system that averages away the instrument’s own noise.
The method chosen depends on how clean the source is compared with the instrument. A spectrum analyzer is fast and available on almost every bench but runs out of dynamic range on good oscillators. Phase detector and cross-correlation systems reach far lower floors at the cost of a reference source, more set-up and longer measurement time. This page belongs to the RF measurement section of the RF design guide; the theory of where phase noise comes from is in phase noise.
What Is Being Measured
A real oscillator output is v(t) = A[1 + α(t)] cos[2πf0t + φ(t)], where α(t) is amplitude noise and φ(t) is phase noise. The fundamental quantity is the one-sided power spectral density of the phase, Sφ(f) in rad2/Hz. The figure usually quoted is
L(f) = 10 log10[Sφ(f)/2] dBc/Hz
For small phase deviations, L(f) equals the power in a 1 Hz bandwidth in one sideband at offset f, relative to the carrier. That equivalence is the basis of the spectrum analyzer method. It breaks down close to the carrier, where the integrated phase deviation is no longer small, so a direct sideband reading there does not represent Sφ/2.
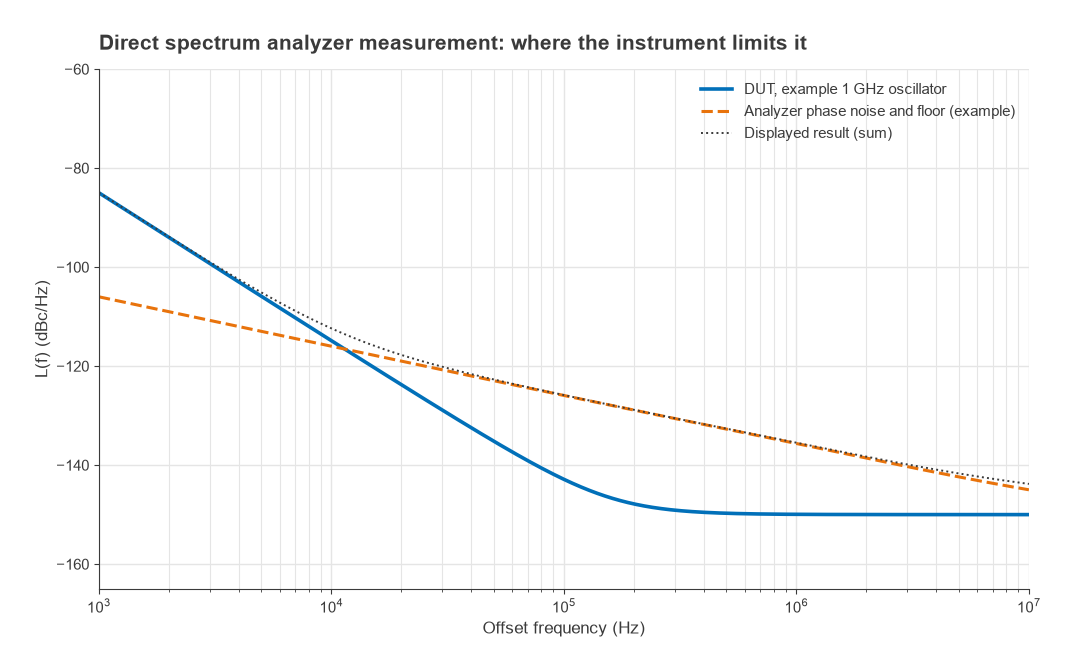
The same data also give integrated phase error and jitter: σφ = √(2∫L(f)df) in radians, and RMS jitter σt = σφ/(2πf0). For the example 1 GHz oscillator in Figure 2, with L(f) of −85 dBc/Hz at 1 kHz, −115 dBc/Hz at 10 kHz and a −150 dBc/Hz floor, integrating from 1 kHz to 10 MHz gives σφ = 1.79 mrad (0.10° RMS) and 285 fs of jitter. The limits of integration must always be stated with a jitter number.
Direct Spectrum Analyzer Method
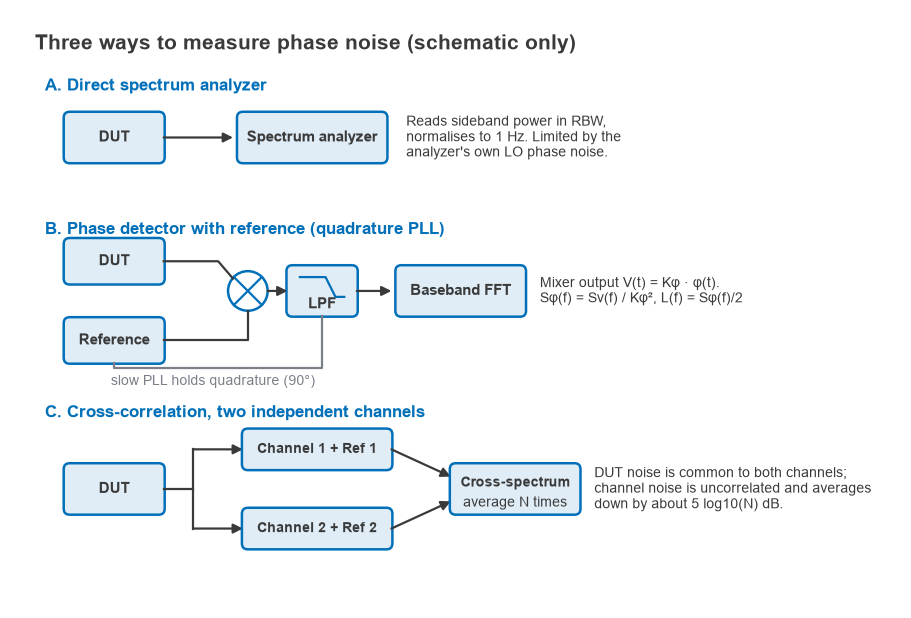
The source is connected straight to a spectrum analyzer. The carrier power is read with a normal marker, and the noise at each offset is read with a noise marker or a log-averaged trace. The noise reading is then normalised to 1 Hz.
- Centre the carrier and set a span a little wider than the largest offset of interest.
- Choose a resolution bandwidth (RBW) well below the offset, typically less than a tenth of it, so the filter skirt of the carrier does not add to the reading.
- Use a sample or RMS detector with video averaging, or the analyzer’s noise marker, which applies the corrections automatically.
- Read the carrier Pc and the noise Pn at offset f.
- Compute L(f) = Pn − Pc − 10 log10(ENBW) + Cdet, where ENBW is the equivalent noise bandwidth of the RBW filter and Cdet corrects the detector response to noise.
Worked example
A 0 dBm carrier is measured at 10 kHz offset with a 1 kHz RBW. A log-averaged trace reads −95 dBm. For a Gaussian RBW filter the ENBW is about 1.065 × RBW, so 10 log10(1065) = 30.3 dB. Averaging the logarithm of noise under-reads its true power by 2.51 dB, so that amount is added back:
L(10 kHz) = −95 − 0 − 30.3 + 2.51 = −122.8 dBc/Hz
Both corrections depend on the analyzer, so the instrument’s own noise-marker values should be used where available. Two errors are easy to miss. The method cannot distinguish phase noise from amplitude noise, and it reports their sum. And the reading always includes the analyzer’s own contribution, as covered next.
Instrument limits
The analyzer’s first local oscillator adds its phase noise to the measurement, and its thermal noise floor limits far-out readings. The displayed result is the power sum of the two, so a reading is accurate only where the source is well above the instrument. The error from an instrument contribution X dB below the DUT is 10 log10(1 + 10−X/10): 1.76 dB at 3 dB margin, 0.97 dB at 6 dB, 0.41 dB at 10 dB and 0.04 dB at 20 dB. A 10 dB margin is a common minimum. Figure 2 shows an example where the DUT clears the analyzer by 10 dB only below about 3.5 kHz offset. Beyond about 11 kHz the analyzer dominates, and the displayed curve follows the analyzer rather than the DUT.
Phase Detector Method
A phase detector removes the carrier, so the dynamic range problem disappears. The DUT and a reference at the same frequency drive a double-balanced mixer held in quadrature (90°) by a slow phase-locked loop. Near quadrature the mixer output is proportional to the phase difference, V(t) = Kφ · φ(t), where Kφ in V/rad is calibrated by measuring the beat note amplitude with the loop open. A low-noise baseband FFT analyzer measures the voltage noise spectrum Sv(f), and
Sφ(f) = Sv(f)/Kφ2, L(f) = Sφ(f)/2
For example, with Kφ = 0.2 V/rad and a measured Sv = −150 dBV2/Hz at 100 kHz offset, Sφ = −150 + 14.0 = −136.0 dB rad2/Hz and L = −139.0 dBc/Hz. That is the combined noise of the DUT and reference. If the reference is known to be much cleaner, the result belongs to the DUT. If two identical sources are compared, each contributes half, and 3 dB is subtracted to give −142.0 dBc/Hz per source.
The PLL that holds quadrature also suppresses DUT phase noise inside its bandwidth. Measurements are therefore made well outside the loop bandwidth, or the known loop response is divided out. The mixer is insensitive to amplitude noise at quadrature, which separates AM from PM. The weakness is the reference: it must be quieter than the DUT, tunable to it, and the system floor is set by the reference, the mixer and the baseband amplifier. The PLL theory behind the method is in frequency synthesis, PLLs and phase noise.
Cross-Correlation: Beating the Instrument Floor
Cross-correlation duplicates the phase detector system. The DUT is split into two channels, each with its own reference and phase detector. The DUT phase noise appears in both channel outputs and is correlated. The noise of each reference and detector is independent. The analyzer computes the cross-spectrum of the two outputs and averages it N times. The correlated DUT term converges to its true value, while the uncorrelated instrument terms average toward zero, improving the effective floor by approximately
ΔLfloor ≈ 5 log10(N) dB
Ten averages give 5 dB, 100 give 10 dB and 10 000 give 20 dB. The square-root law makes deep improvements expensive. Suppose a single channel has a −150 dBc/Hz floor at 10 MHz offset and the DUT is a low-noise source at −165 dBc/Hz. To bring the floor 10 dB below the DUT, to −175 dBc/Hz, needs 25 dB of improvement and N = 105 averages. With 10 kHz analysis resolution at that offset, each average takes roughly 100 µs, so about 10 s, but at 1 kHz offset with 10 Hz resolution, the same N would take hours. Figure 3 shows how the floor drops with N and where an example DUT emerges from it.
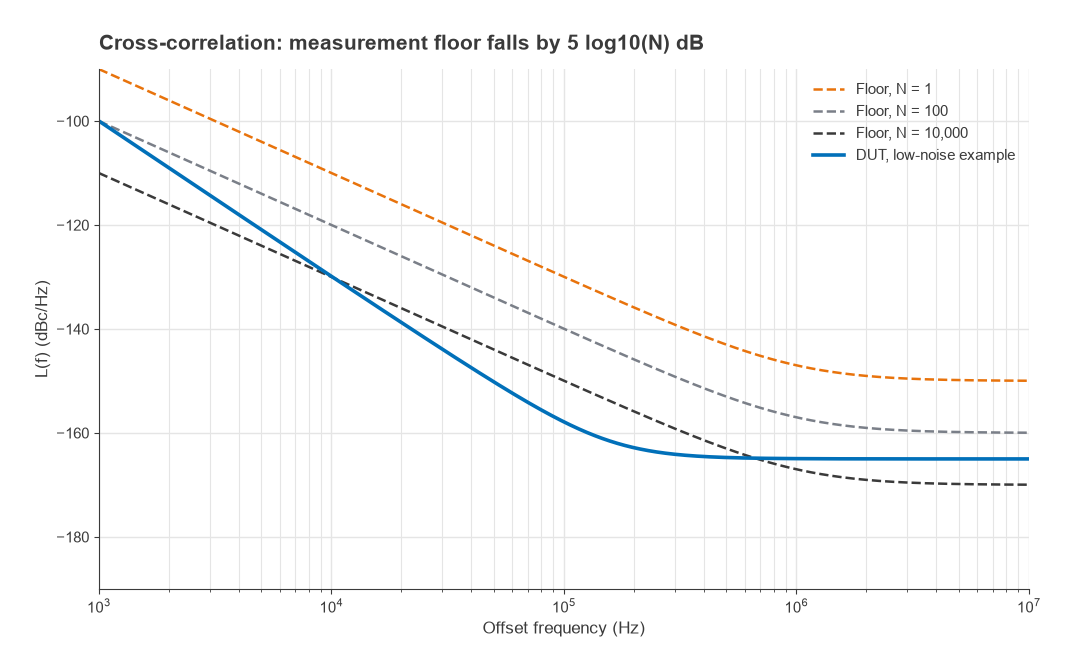
Cross-correlation has limits of its own. Noise that is common to both channels, such as power-supply coupling, a shared splitter or AM-to-PM conversion in the mixers, does not average away. When the DUT is far below the floor, the averaged cross-spectrum can fall below the true value or change sign at some offsets, so readings should be checked for convergence by watching them as N increases. Modern signal source analyzers and some high-end spectrum analyzers implement the whole scheme in one instrument, with digital phase detection after sampling.
Delay-Line Discriminator
When no clean reference at the DUT frequency is available, for example with a free-running microwave VCO that drifts, a delay line can stand in. The signal is split, one path is delayed by τ, and the two are compared in a quadrature mixer. The line converts frequency fluctuations into phase differences, so the system responds to the DUT without a second source. Its phase sensitivity relative to a reference-based detector is
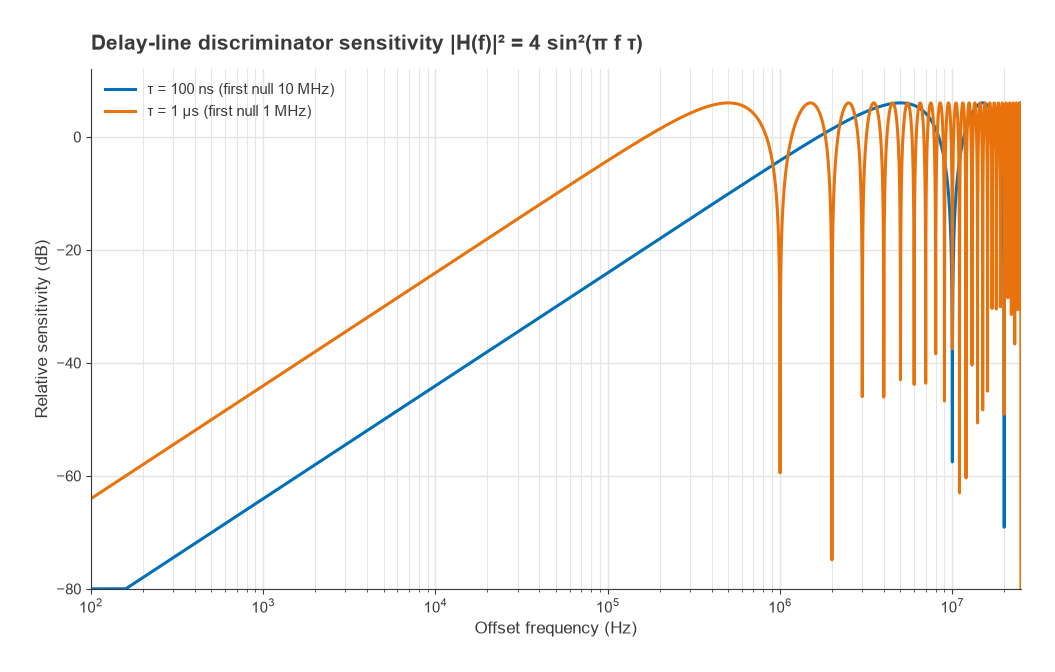
|H(f)|2 = 4 sin2(πfτ) ≈ (2πfτ)2 for fτ ≪ 1
The method loses sensitivity close to the carrier, at 20 dB per decade. With τ = 100 ns the sensitivity at 10 kHz offset is −44 dB relative to a phase detector; with τ = 1 µs it is −24 dB. Longer lines help close in but add loss and place nulls at multiples of 1/τ, 1 MHz for the 1 µs line, where nothing can be measured, as Figure 4 shows. The discriminator therefore suits noisy sources at moderate offsets better than clean sources close in.
Choosing a Method
| Method | Reference needed | Separates AM and PM | Typical use | Main limit |
|---|---|---|---|---|
| Direct spectrum analyzer | No | No | Quick checks, noisy sources, far-out spurs | Analyzer LO phase noise and noise floor |
| Phase detector (PLL) | Yes, cleaner than DUT | Yes | Synthesizers, crystal oscillators | Reference noise, loop suppression close in |
| Cross-correlation | Two, independent | Yes | Very low-noise oscillators, references, ADC clocks | Measurement time, correlated spurious paths |
| Delay-line discriminator | No | Yes | Drifting or noisy microwave sources | Low sensitivity close to the carrier, nulls at n/τ |
Good practice is the same for all of them. Power the DUT from a quiet supply, keep it isolated from load changes with an attenuator or isolator, and check that spurs on the plot belong to the DUT by moving its frequency or supply. Record the RBW, averaging and offset range, and state which corrections were applied. The source being measured is often a VCO, a TCXO or OCXO or a DDS, and the impact of the result on a radio is covered in measuring radio performance, Part 20 of Radio Architectures.
Frequently Asked Questions
How is phase noise measured?
Either directly on a spectrum analyzer, by subtracting carrier power from the noise power at each offset and normalising to 1 Hz, or with a phase detector that compares the source with a reference and measures the baseband noise. Cross-correlation of two such channels lowers the floor further by averaging out instrument noise.
Can I measure phase noise with a spectrum analyzer?
Yes, if the source is at least about 10 dB noisier than the analyzer at every offset of interest. Apply the bandwidth and detector corrections, and remember that the reading includes amplitude noise.
How many averages does cross-correlation need?
The floor improves by about 5 log10(N) dB, so 10 dB needs 100 averages and 20 dB needs 10 000. Close-in offsets take far longer because each average needs a finer frequency resolution.
How do I convert phase noise to jitter?
Integrate L(f) in linear units over the offset range of interest, take σφ = √(2∫L df) and divide by 2πf0. The example 1 GHz oscillator gives 285 fs from 1 kHz to 10 MHz.
Related Topics
The RF measurement hub links the other measurement guides, including noise figure measurement and VNA basics. Oscillator design topics are gathered under RF oscillators, and definitions of the terms used here are in the wireless terms glossary.