

An RF amplifier datasheet is a set of measured small-signal, noise, large-signal and DC specifications, each valid only under the test conditions printed next to it. Gain, flatness and noise figure describe weak-signal behaviour; P1dB and OIP3 describe how much power the part can handle before distorting; VSWR, reverse isolation and supply current describe how it fits into a system. Reading one well means checking the conditions as carefully as the numbers.
This guide walks through each specification in the order it usually appears, explains what it means for a design, and then works through a complete example. It belongs to the RF amplifiers section and applies equally to low-noise amplifiers, gain blocks and driver amplifiers. The example uses a hypothetical 0.5 to 6 GHz gain block rather than a real part.
The specifications, one by one
Gain and gain flatness
Gain on an amplifier datasheet is almost always |S21|2 in dB, measured in a 50 Ω system. That is transducer gain with matched source and load, so it already includes the loss caused by the amplifier’s own input and output mismatch. The power gain definitions page explains why other gain figures differ from it.
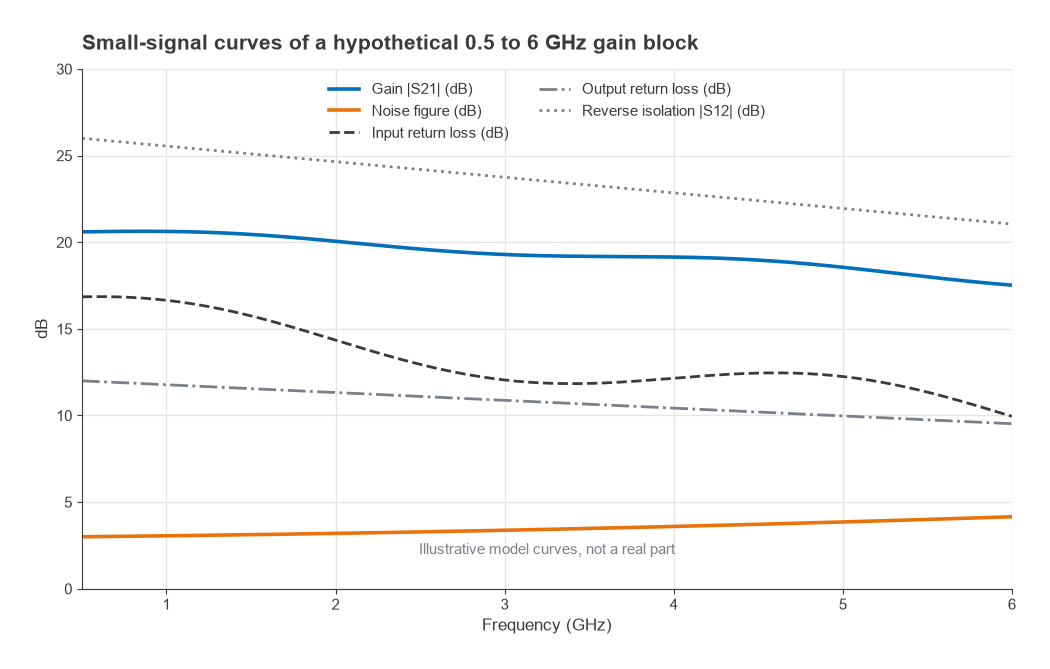
Flatness is the peak-to-peak or ± variation of gain over a stated band. A broadband gain block often has a gain slope that falls with frequency, so the flatness figure depends heavily on how wide the band is. A part quoted at ±0.4 dB over 500 MHz may vary by ±1.5 dB over its full range. Check which band the flatness applies to before comparing two parts.
Noise figure
Noise figure (NF) is the degradation in SNR caused by the amplifier, measured with a 50 Ω source at a reference temperature of 290 K. It sets how much the part adds to the receiver noise floor, as explained on the noise figure page. Two details matter. First, the minimum noise figure NFmin, which some transistor datasheets list, is reached only with an optimum source impedance and is not what a 50 Ω matched design achieves. Second, the datasheet may or may not have removed the loss of the evaluation board’s input trace and connector. A 0.2 dB difference there is large compared with a 0.6 dB LNA.
P1dB and saturated power
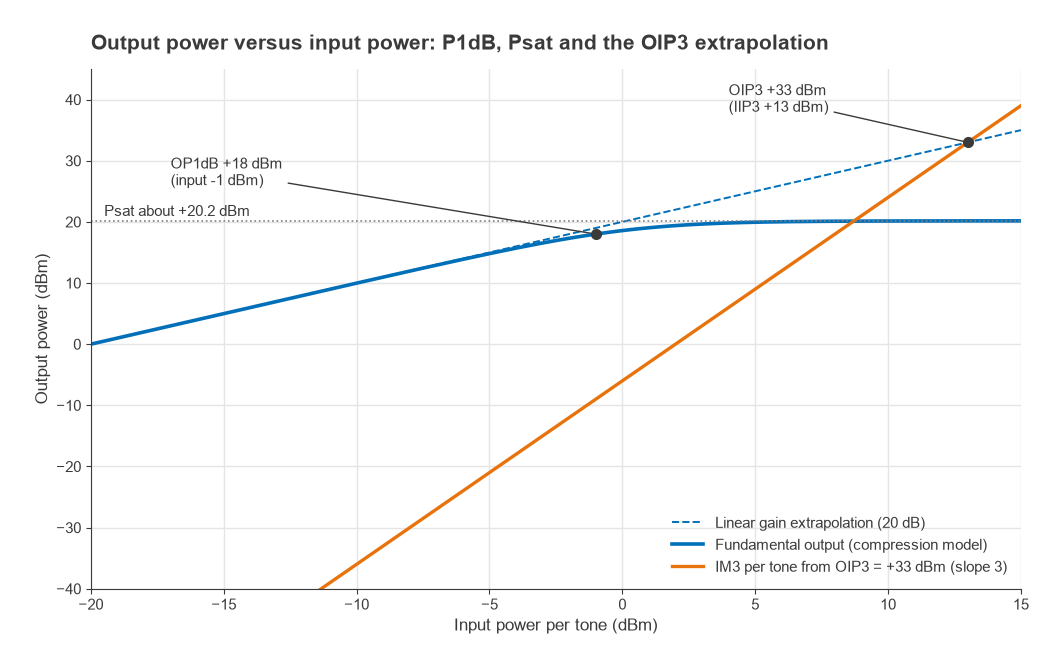
The 1 dB compression point is the power at which gain has fallen 1 dB below its small-signal value. Datasheets usually give the output-referred value, OP1dB. The input-referred value is IP1dB = OP1dB − (G − 1) dB, because at that point the gain is one dB lower. Saturated output power, Psat, is the maximum the amplifier can deliver however hard it is driven. Continuous operation near Psat causes severe distortion. The P1dB and gain compression page covers both in detail.
OIP3
The output third-order intercept point is the extrapolated output power at which the third-order intermodulation product of two equal tones would equal the wanted tones. It is not a power the amplifier can produce. It is a figure of merit that predicts IM3 at lower levels through IM3out = 3Pout − 2·OIP3, with all values in dBm per tone. For many simple amplifiers OIP3 sits roughly 10 dB above OP1dB, but the gap varies with bias and device technology, and a larger gap usually means the part was designed for linearity. Radio Architectures Part 3 derives the relationship.
Input and output VSWR or return loss
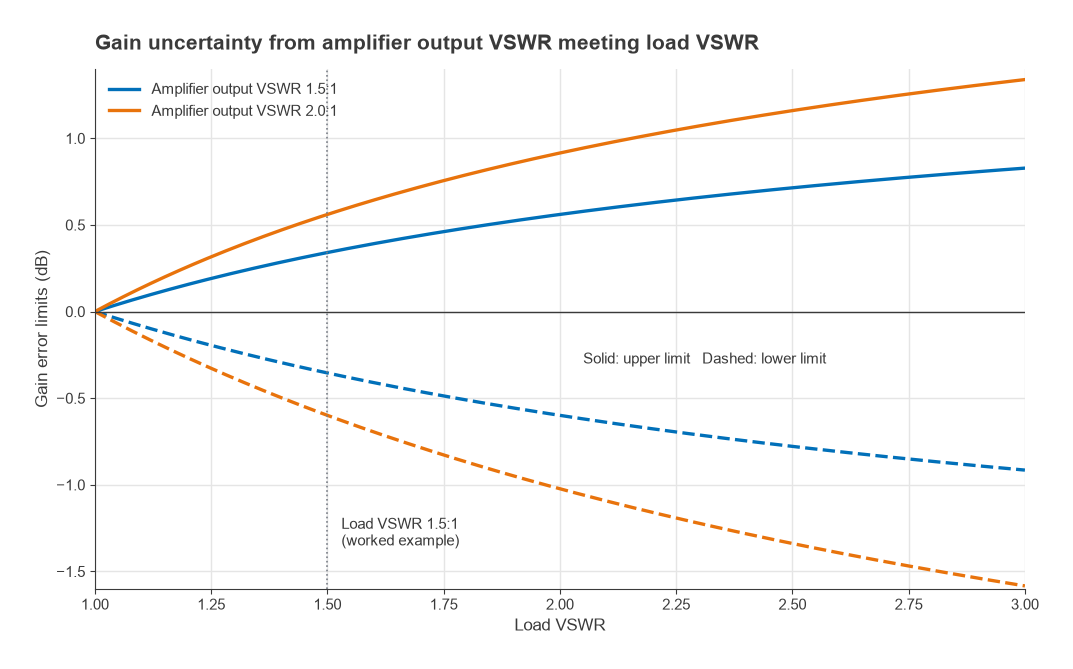
These describe how close the amplifier’s ports are to 50 Ω. Some datasheets give VSWR, others return loss in dB, which is |S11| or |S22| with the sign removed. The conversion goes through the reflection coefficient: |Γ| = (VSWR − 1)/(VSWR + 1) and RL = −20log|Γ|. Poor port match matters for two reasons. It causes ripple and gain uncertainty when the amplifier meets a filter or cable that is also imperfect, and it changes the response of whatever sits next to the amplifier, particularly filters. The VSWR and return loss page has a converter.
Reverse isolation
Reverse isolation is |S12| in dB, the loss from output to input. High isolation keeps an LO or a transmitter signal at the output from leaking back to the antenna, and it makes the input match independent of what is connected to the output. It also feeds the stability calculation: the Rollett factor K depends on the product S12S21, so an amplifier with high gain and poor isolation is more prone to oscillation. See amplifier stability for the test.
Supply voltage, current and thermal data
DC specifications give the operating voltage and quiescent current, and sometimes how current rises under drive. Many gain blocks are biased through an external resistor and an RF choke on the output pin, and the datasheet’s current value assumes the recommended resistor at a specific supply. The biasing page explains those networks. Thermal resistance from junction to case or to the paddle, together with the maximum junction temperature, lets the designer check the part at the highest ambient temperature it will see.
Absolute maximum ratings
The absolute maximum table lists supply voltage, RF input power, junction temperature and storage limits that must never be exceeded. These are survival limits, not operating conditions, and performance is not guaranteed anywhere near them. An LNA with a maximum input rating of +15 dBm, for example, needs protection if it sits next to a transmitter that can couple more than that into its input.
Test conditions: the caveats behind every number
Every specification is a measurement on a particular board, at a particular temperature, frequency and bias. Before comparing parts or entering values into a lineup, check the following:
- Typical versus minimum or maximum. Most RF datasheets give typical values only. A guaranteed minimum gain or maximum noise figure, where one exists, is the number to design to.
- Temperature. Tables are usually at 25 °C. Gain generally falls and noise figure rises as temperature increases; the plots, if provided, show how much.
- Frequency. A single table value is often at one frequency. The plots show the rest of the band, and the worst point in the band is what matters.
- Bias. Gain, P1dB and OIP3 depend on supply voltage and current. Running the part at a lower current to save power usually costs linearity.
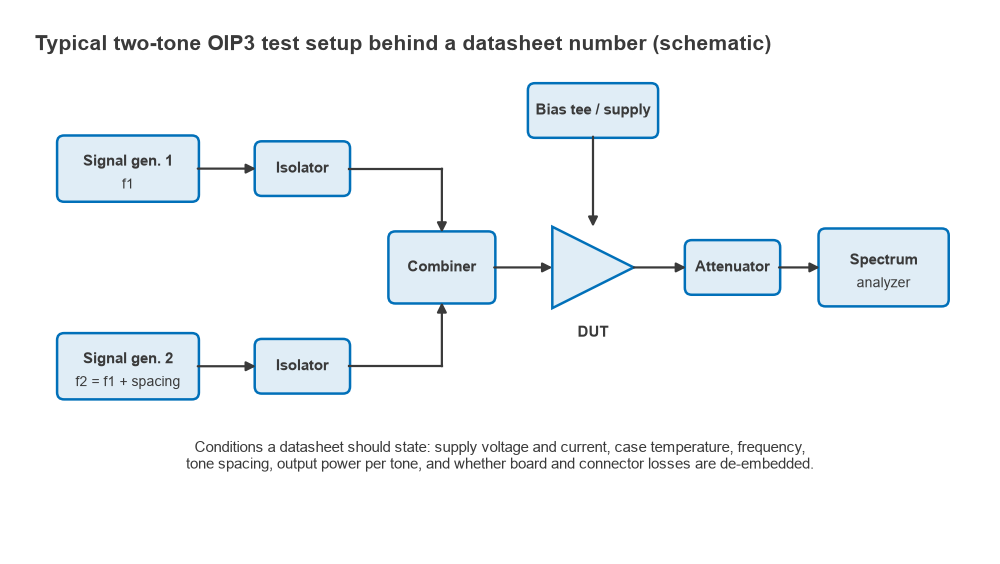
- OIP3 conditions. The value should come with a tone spacing and an output power per tone. OIP3 measured at low power with a wide spacing is often higher than at higher power or with a spacing that excites bias-network resonances.
- De-embedding. State whether board and connector losses are included. This affects gain, noise figure and P1dB.
How to read a datasheet, step by step
- Confirm the frequency range, supply and package fit the application before reading anything else.
- Read gain and flatness over your band, not the full rated range, using the plots.
- Read noise figure at the worst frequency in your band and note whether it is de-embedded.
- Convert OP1dB and OIP3 to input-referred values by subtracting gain, and check them against the largest signals the stage will see.
- Convert VSWR or return loss to |Γ| and estimate mismatch loss and gain uncertainty against the neighbouring components.
- Check reverse isolation and stability data, especially if the source or load will not be 50 Ω.
- Compute DC power and junction temperature at the maximum ambient temperature.
- Compare the input signals the system can apply against the absolute maximum ratings.
Worked example: a hypothetical gain block
Suppose a datasheet for a 0.5 to 6 GHz gain block gives these typical values at 2 GHz, 5 V supply and 25 °C:
| Specification | Value at 2 GHz | Derived value |
|---|---|---|
| Gain | 20.0 dB | Power ratio 100 |
| Gain flatness | ±0.4 dB, 1.5 to 2.5 GHz | About ±1.6 dB over 0.5 to 6 GHz from the plot |
| Noise figure | 3.2 dB | Noise factor 2.09 |
| OP1dB | +18 dBm | IP1dB = 18 − 19 = −1 dBm |
| OIP3 | +33 dBm | IIP3 = 33 − 20 = +13 dBm |
| Input return loss | 14.3 dB | |Γ| = 0.19, VSWR about 1.47:1 |
| Output return loss | 11.3 dB (9.5 dB at 6 GHz) | VSWR about 1.75:1 (2.0:1 at 6 GHz) |
| Reverse isolation | 24.6 dB | S12S21 product of −4.6 dB |
| Supply | 5 V, 80 mA | PDC = 0.40 W |
Working through the numbers:
- Linearity headroom. OIP3 − OP1dB = 15 dB, a wide gap that suggests a part biased for linearity. With two tones at +5 dBm each at the output, IM3 = 3 × 5 − 2 × 33 = −51 dBm per product, or 56 dBc below each tone.
- Efficiency. At OP1dB the output is 63.1 mW against 400 mW of DC input, an efficiency of 15.8 percent. Gain blocks are not efficient, and most of the DC power becomes heat.
- Junction temperature. Dissipation is about 0.4 W. If the datasheet gives a junction-to-case thermal resistance of 60 °C/W, the junction runs about 24 °C above the case.
- Mismatch at the output. At 6 GHz the output VSWR is 2.0:1, so |Γ| = 0.333 and the mismatch loss into a perfect load is −10log(1 − 0.3332) = 0.51 dB. If the load is a filter with VSWR 1.5:1 (|Γ| = 0.2), the gain can vary by 20log(1 ± 0.333 × 0.2), from +0.56 dB to −0.60 dB, depending on the phase between the two reflections.
- Compression check. If the strongest signal at the input is −10 dBm, it sits 9 dB below IP1dB and 23 dB below IIP3, comfortably in the linear region.
The same values can be dropped into a lineup table. The cascaded IP3 and cascaded noise figure pages show how this one stage’s numbers combine with the rest of a receiver.
Reading the plots
The tables give one point; the plots give the behaviour that a design has to live with. Look for gain slope across the band, the frequency where return loss is worst, and how the curves spread over temperature or supply voltage. Plots of S-parameters are often backed by a downloadable Touchstone file, which is more useful than any table because it can be loaded straight into a simulator. Plots of P1dB and OIP3 versus frequency frequently show the large-signal performance falling at the top of the band, which a single table value hides.
When comparing amplifiers for a specific role, the LNA selection guide and the broadband amplifier selection guide show which of these specifications matter most for each application.
Frequently asked questions
What do the specs on an RF amplifier datasheet mean?
Gain and flatness describe amplification across the band, noise figure describes added noise, P1dB and OIP3 describe how large a signal can be before distortion becomes significant, and VSWR and isolation describe how the part interacts with its neighbours. Supply current and thermal resistance describe power use and heat. Each value applies only under the stated test conditions.
How do I convert OIP3 to IIP3?
Subtract the gain in dB: IIP3 = OIP3 − G. An amplifier with 20 dB gain and OIP3 of +33 dBm has an IIP3 of +13 dBm. The input-referred value is the one to compare with interferer levels at the amplifier’s input.
Why does my measured gain differ from the datasheet?
Common causes are board and connector losses that the datasheet removed, a different bias resistor or supply, mismatch with neighbouring parts and temperature. Mismatch alone can move gain by several tenths of a dB, as the worked example shows.
Related topics
For the design side of the same specifications, see low noise amplifier design and S-parameters explained. Thermal limits for higher-power parts are covered in thermal design for RF power amplifiers, and the RF design guide places amplifiers in the wider design process.