

An RF power detector is a circuit that converts the power of a radio-frequency signal into a DC or low-frequency voltage that a comparator, ADC or control loop can read. The three common families are diode detectors, which rectify the waveform; RMS detectors, which respond to the true mean-square power; and logarithmic amplifiers, whose output in volts is proportional to the input in dBm.
Detectors sit behind directional couplers in transmitter power control loops, at the input of receivers for automatic gain control, and inside test equipment that reports power or VSWR. They belong to the RF passive components and building blocks section of the RF design guide.
How an RF Power Detector Works
Every detector relies on a nonlinear element. A purely linear network cannot produce a DC output from a sinusoid because the average of a sine wave is zero. A diode, a transistor junction or a squaring cell distorts the waveform so that a DC term appears, and a low-pass filter (often called the video filter) strips off the RF and its harmonics. What differs between detector types is how the size of that DC term depends on the input: in proportion to power, to peak voltage, or to the logarithm of power.
The input power and the RF voltage are tied together by the load. For a sinusoid across a matched 50 Ω termination, the peak voltage is
Vpk = √(2 · P · Z0)
so −30 dBm (1 µW) corresponds to 10.0 mV peak, −10 dBm to 100 mV and 0 dBm to 316 mV. Conversions between dBm, watts and volts are covered in dB and dBm explained.
Diode Detectors
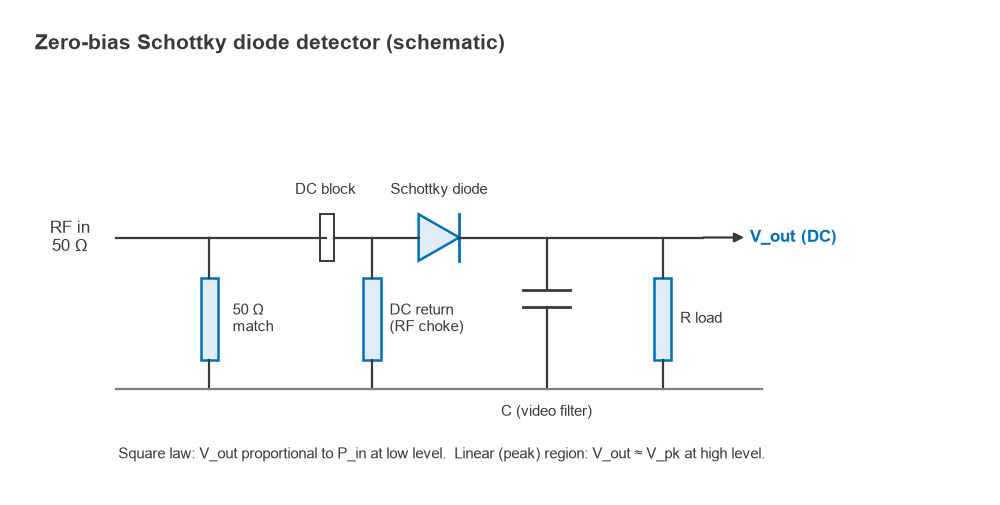
The simplest detector is a single Schottky diode followed by a capacitor. A 50 Ω resistor at the input sets the match, a DC return path keeps the diode’s average current from charging the input, and the capacitor holds the rectified voltage. Zero-bias Schottky diodes, with a low barrier height, are common because they need no bias current and therefore add no DC offset that drifts with temperature. Biased diodes respond faster but carry a DC offset that must be cancelled, often with a matched reference diode.
Square-law and linear regions
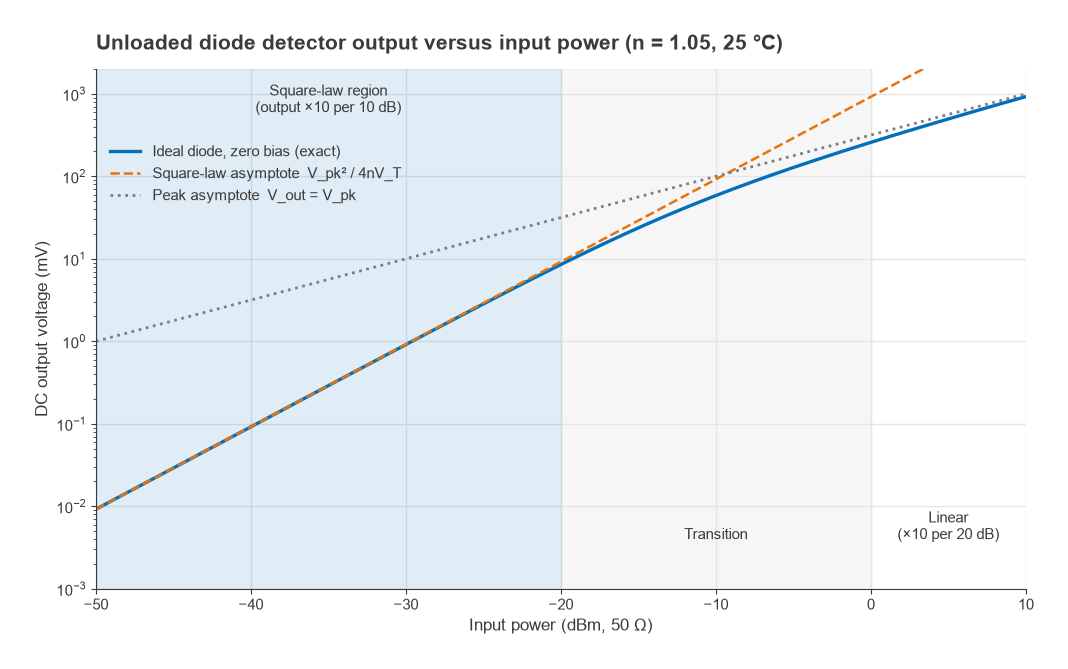
The diode current follows I = Is[exp(V/nVT) − 1], where n is the ideality factor and VT = kT/q ≈ 25.85 mV at 25 °C. For an unloaded detector (the capacitor draws no current), the average diode current must be zero, which gives an exact result in terms of the modified Bessel function I0:
Vout = nVT · ln I0(Vpk / nVT)
Two limits follow from this. When Vpk is much smaller than nVT, the output reduces to Vout ≈ Vpk2 / (4nVT). Because Vpk2 is proportional to power, the output voltage is proportional to input power: this is the square-law region, where 10 dB more input gives ten times more output voltage. When Vpk is much larger than nVT, the diode behaves as a peak detector and Vout approaches Vpk less a small offset. Output voltage then rises tenfold for every 20 dB of input, as the RF voltage itself does.
Worked example: zero-bias Schottky detector
Take an ideal diode with n = 1.05 at 25 °C, so nVT = 27.1 mV, driven from a matched 50 Ω source.
- At −30 dBm, Vpk = 10.0 mV. The square-law formula gives (0.010)2 / (4 × 0.0271) = 0.921 mV; the exact Bessel result is 0.913 mV. The two agree within 1 %, and the voltage sensitivity is about 0.91 mV per µW.
- At −20 dBm, Vpk = 31.6 mV. Square law predicts 9.21 mV; the exact output is 8.53 mV, 7 % low, so a square-law calibration would read 0.3 dB under the true power.
- At −10 dBm, Vpk = 100 mV. Square law predicts 92.1 mV but the diode delivers 58.5 mV. Reading this with a square-law calibration would understate the power by 10·log(58.5/92.1) = 2.0 dB.
A real diode has junction capacitance, series resistance and a finite video load, all of which reduce the sensitivity below the ideal figure, so the absolute millivolt values above are upper bounds. The shape of the curve, and the location of the transition between roughly −20 dBm and 0 dBm, carries over to practical zero-bias detectors. Below the square-law region, sensitivity is limited by the diode’s thermal noise in the video bandwidth, which for typical zero-bias parts places the usable floor somewhere in the −50 to −60 dBm range.
Waveform dependence
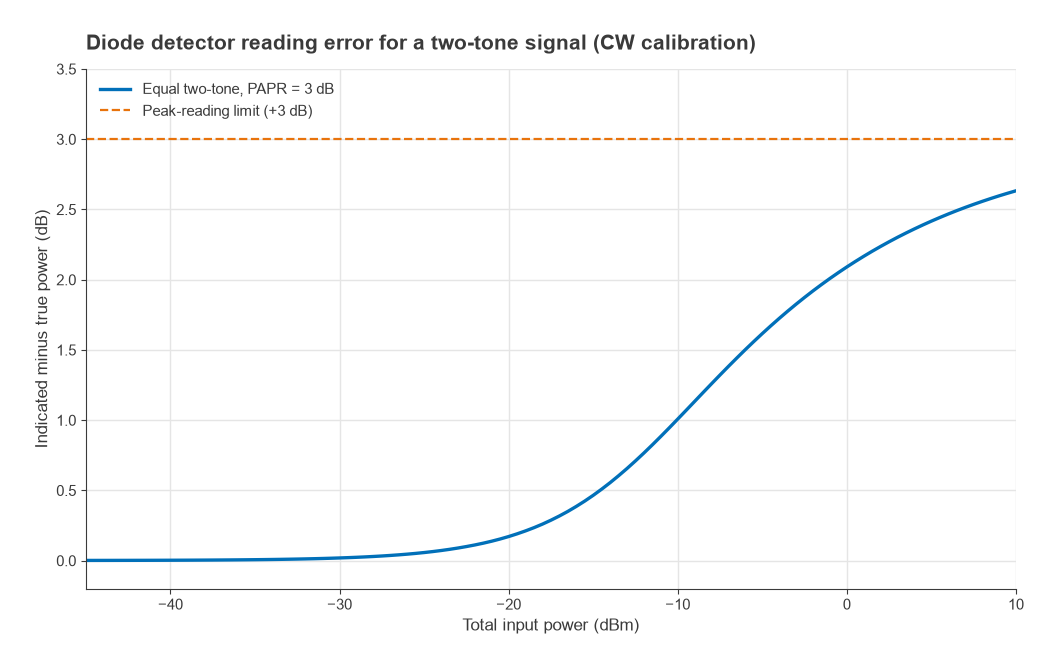
In the square-law region a diode detector measures the true average power of any waveform, because its output depends on the mean of v2. In the linear region it tracks the peak instead. A signal with a high peak-to-average power ratio (PAPR) then reads high. For an equal-amplitude two-tone signal, whose PAPR is 3 dB, the error relative to a CW calibration is 0.02 dB at −30 dBm, 0.17 dB at −20 dBm, 1.0 dB at −10 dBm and 2.1 dB at 0 dBm, approaching the full 3 dB at high level. OFDM signals, with PAPR around 8 to 12 dB, make this worse, which is one reason detector choice is tied to the modulation; see modulation, EVM and PAPR.
RMS Detectors
An RMS detector is designed to produce an output proportional to the root-mean-square value of the input voltage, Vrms = √(mean v2), over a much wider range than a diode’s square-law region. Integrated RMS detectors typically use a squaring cell (or a translinear computing loop) followed by an averaging capacitor and a square-root or feedback stage. Because the output depends only on mean-square voltage, two signals with the same average power give the same reading whether they are CW, two-tone or a high-PAPR multicarrier waveform, provided the peaks stay inside the detector’s input range.
Some RMS detectors present a linear-in-volts output and others a linear-in-dB output; the latter combine RMS response with log-amp style scaling. The averaging capacitor sets the trade-off between residual ripple, which shows up as reading noise on signals with slow envelope variation, and response time. For a power-control loop that must settle within a transmit slot, that capacitor is often the dominant pole in the loop.
Logarithmic Amplifiers
A demodulating log amp produces an output that is linear in dB. The ideal transfer function is
Vout = Vslope · (Pin − Pintercept)
where Vslope is in mV/dB and Pintercept is the extrapolated input power at which the output would reach zero. Most use successive detection: a chain of limiting amplifiers, each with modest gain, with a detector at every stage output whose currents are summed. At low input, only the last stages contribute; as the input rises, each stage in turn saturates and its detector output reaches a fixed ceiling. Each 10 dB stage therefore adds roughly one fixed increment of output per 10 dB of input, and the sum approximates a logarithm with a small periodic ripple.
Worked example: successive-detection model
A simple numerical model uses eight limiting stages with 10 dB gain each (80 dB in total), a tanh limiting characteristic, and full-wave detectors on the input and every stage output. Scaling the summed output to a 25 mV/dB slope and fitting a line over −80 to −25 dBm gives an intercept of −102.6 dBm. The model stays within ±0.5 dB of the ideal line from −88.8 dBm to −24.3 dBm, a dynamic range of about 64 dB, and within ±1 dB from −92.5 dBm to −20.5 dBm.
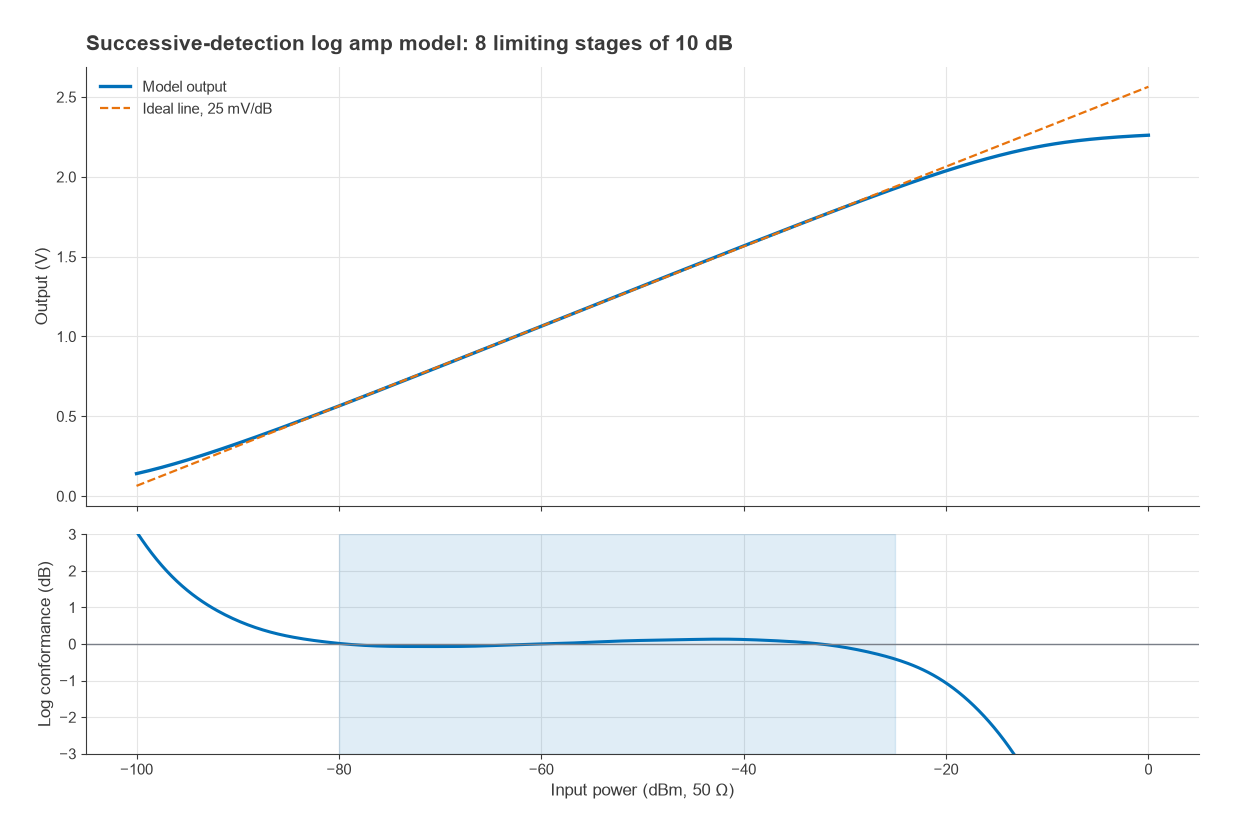
With that transfer function, an input of −40 dBm produces Vout = 0.025 × (−40 + 102.6) = 1.56 V. Working backwards, a reading of 0.9 V means Pin = −102.6 + 0.9/0.025 = −66.6 dBm. Firmware performs the same conversion on the ADC code, usually after a two-point calibration of slope and intercept on each unit.
Log amps respond to the envelope, not to true power, so their reading also shifts with waveform. The shift is roughly a constant number of dB for a given modulation format across most of the range, which makes it straightforward to correct once the format is known.
Comparing Detector Types
| Property | Diode (zero-bias) | RMS detector | Log amp |
|---|---|---|---|
| Output law | Square law at low level, peak at high level | Proportional to Vrms (or dB of it) | Linear in dB |
| Typical dynamic range | About 30 to 50 dB usable | About 30 to 60 dB | About 50 to 100 dB |
| Waveform sensitivity | Low in square law, high in linear region | Low (true power) | Moderate, roughly constant offset |
| Response time | Very fast (ns possible) | Set by averaging capacitor | Fast (tens of ns typical) |
| Power and complexity | Passive, very simple | Active IC | Active IC |
| Typical use | Pulse and envelope detection, simple level sensing | PA power control with modulated signals | RSSI, AGC, wide-range monitoring |
The ranges in the table are typical figures for the class, not limits for any particular device. Temperature drift affects all three. A diode detector’s sensitivity falls as nVT rises with temperature, so precision designs add a reference diode or a temperature sensor and a correction table.
Detectors in a Power Control Loop
The classic transmitter arrangement places a directional coupler after the power amplifier, attenuates the coupled sample into the detector’s best range, and compares the detector output with a set-point. Suppose the PA delivers +30 dBm and the coupler has 30 dB coupling: 0 dBm appears at the coupled port. A 30 dB attenuator brings this to −30 dBm, inside the ±0.5 dB range of the log amp model above, which would read 0.025 × (−30 + 102.6) = 1.81 V.
Coupler directivity limits accuracy when the antenna mismatch is poor, because reflected power leaks into the forward-coupled port and adds to or subtracts from the reading. A second detector on the reverse-coupled port allows the loop to measure return loss as well, which is how many transmitters implement VSWR protection. For linearised amplifiers, detector accuracy directly affects how well the loop holds output power, which interacts with PA linearization.
Practical Design Notes
- Match the detector input. A diode presents a high, level-dependent impedance; the 50 Ω termination in front of it sets the match and defines the voltage across the diode.
- Calibrate at two or more points. Slope and intercept vary from part to part, and a diode’s curvature needs a table rather than a single gain constant.
- Verify the loop against a thermal power sensor or a calibrated meter, as described in measuring amplitude and power in RF signals.
Frequently Asked Questions
How does an RF power detector work?
It passes the RF signal through a nonlinear element, such as a diode or a squaring cell, which creates a DC component related to the signal level. A low-pass filter removes the RF, leaving a voltage that depends on power, peak voltage or the logarithm of power, depending on the detector type.
What is the square-law region of a diode detector?
It is the low-level range, roughly below −20 dBm for a zero-bias Schottky diode, where the output voltage is proportional to input power. In that region the detector reads true average power regardless of waveform. Above it the diode becomes a peak detector.
What is the difference between an RMS detector and a log amp?
An RMS detector responds to mean-square voltage and so reads the same power for any waveform shape. A log amp responds to the signal envelope and gives an output linear in dB over a very wide range, but its reading shifts by a waveform-dependent offset.
Related Topics
The RF passive components hub lists the other building blocks around a detector, including directional couplers, attenuators and hybrid couplers. Detector-based measurements also appear in RF measurement and test and in Radio Architectures Part 20: measuring radio performance.