INTRODUCTION
Skin disease affects one in four individuals at a total cost of US $75 billion in yearly spending in the United States (1). However, misdiagnosis rates range between <10% for dermatologists and 50 to 80% among general practitioners, the latter of whom receive the most patient visits related to skin conditions (2–4). Visual identification of skin diseases is nonideal because of the indistinct nature of disease appearance. Common symptoms for various skin diseases such as inflammation, erythema, and edema are unspecific, and visual tracking of symptom severity is difficult. The inverse scenario is also true: a particular disease, such as atopic dermatitis (AD) or eczema, may have several subcategories that present different visual cues (5, 6). Therefore, solely relying on lesion morphology is insufficient to determine the state of subsurface layers of skin, particularly in individuals with skin of color, such as the type and extent of damage to the tissue, progression of the disease, and chronicity of the lesion. Clinical tools and procedures used for diagnosis such as biopsies, dermoscopy, magnetic resonance imaging (MRI), and corneometry are expensive, often not widely accessible, and typically uncomfortable for sensitive regions of the skin. The measurements can be time-consuming and/or error prone. These circumstances motivate the need for efficient and intuitive tools to monitor skin health compatible with use both inside and outside the clinic, in any environment, and on nearly any location on the body surface.
Thermal sensing is a novel and noninvasive approach to monitoring skin health. Unlike traditional electrical impedance–based techniques (corneometry), these sensors can measure the thermal properties of skin as a function of depth up to several millimeters (7). Skin-mounted thermal sensors demonstrated in past literature involve some combination of limiting drawbacks, including (i) shallow measurement depth (less than a few hundred micrometers), (ii) requirements for expensive cleanroom processes in microfabrication, (iii) external power source/battery-reliant operation, (iv) absence of theoretical frameworks to provide direct connections between the measured data and clinically relevant information like skin water content, (v) large measurement errors (±12%) and poor repeatability, (vi) lack of smartphone integration/convenient sensor readout capabilities, and/or (vii) lack of clinical validation across a range of important skin disorders and conditions, inside and outside of hospital facilities (7–9).
Here, we report a set of results in materials, device designs, and analysis approaches that address all these aforementioned challenges, in the form of a soft, thin, wireless, and battery-free skin hydration sensor (SHS) and corresponding models that can be used to accurately assess water content of skin regardless of body location or environment. Careful systems-level engineering enables highly robust, reliable measurements and with platforms that are compatible with established manufacturing techniques for consumer electronics gadgetry, with readily available off-the-shelf components. Theoretical modeling establishes a means to directly determine the volumetric water content in skin as a function of depth from the raw data obtained using the sensors. Benchtop characterization tests and studies using healthy/normal participants establish the accuracy and reliability of the SHS devices, as well as the essential engineering parameters that affect these quantities. Key results include clinical use of the SHS on n = 13 patients with a wide range of inflammatory skin conditions (e.g., AD, psoriasis, urticaria, xerosis cutis, and rosacea), with benchmarks against standard tools to quantitatively characterize the diseased locations. Additional clinical demonstrations include tracking improvements in skin water content after application of a topical moisturizer.
RESULTS
Device structure and operation
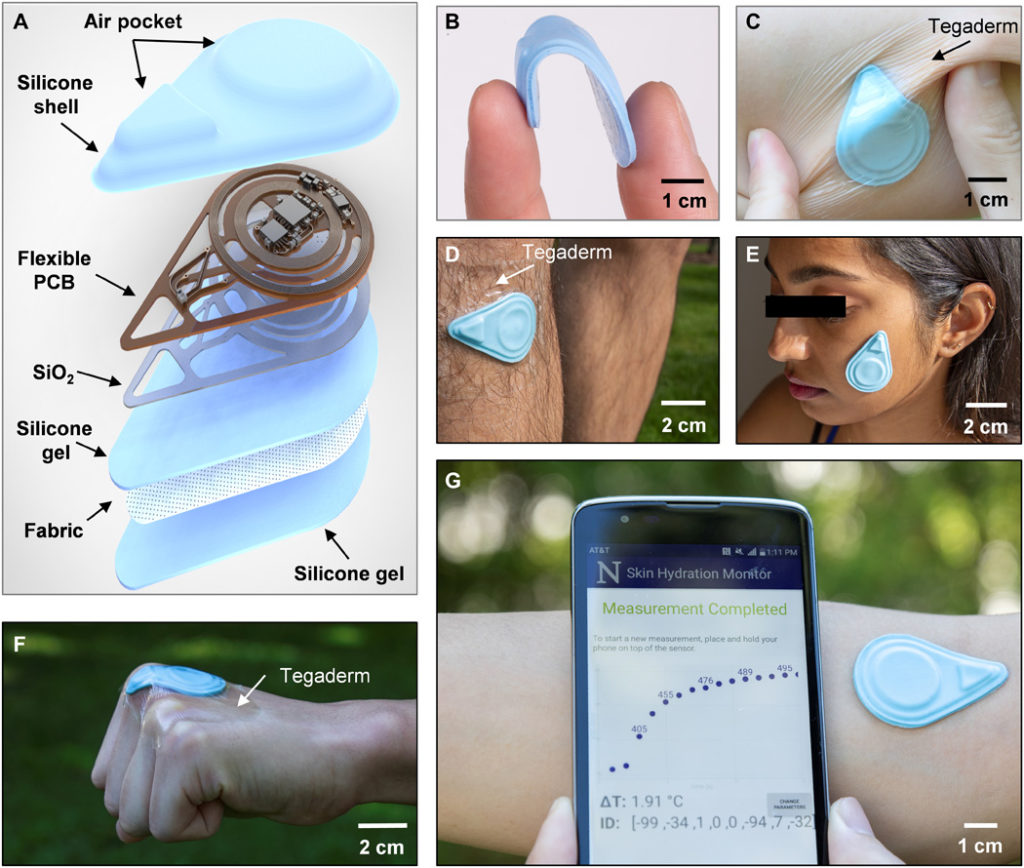
The SHS measures the thermal properties (conductivity k and diffusivity α) of the skin using the transient plane source (TPS) technique. TPS exploits joule heating via a resistive element placed on top of a sample of interest while simultaneously recording the transient temperature change (ΔT) of the heating element itself or of a separate temperature sensor (10). An exploded-view diagram of the SHS appears in Fig. 1A. The flexible printed circuit board (f-PCB) contains electronics for sensing and wireless communication. Open spaces/mechanical relief cuts in the polyimide (PI) layer of the f-PCB enhance the overall flexibility and limit lateral thermal transport through the PI, away from the sensing components. To ensure low thermal resistance to the skin, a thin bottom silicone gel adhesive (~120 μm thick) bonds by a covalent dehydration reaction between ─OH groups on the surface of the silicone to a thin layer of SiO2 (~75 nm) sputter coated on the backside of the f-PCB. An ultrathin fabric of fiberglass (~30 μm) embedded in the silicone gel greatly enhances the mechanical robustness of the system. Repeated application and removal of the device are possible without irritation to the skin or damage to the device. Cleaning with alcohol wipes provides a convenient means to sterilize the device for use across different patients with minimal risk and restores the tackiness of the adhesive by eliminating particulates or other contaminants (sensors were tested for at least 130 times on average without damage). The shell-like top encapsulation layer creates small air gaps to thermally insulate the critical sensing components. This design also leads to low flexural rigidity and effective modulus, to facilitate application even on highly curved features of the body. Detailed fabrication procedures are in Materials and Methods, note S1, and fig. S1.

(A) Diagram illustrating the layers and components of the device. (B) Photograph of a sensor bent between the thumb and index finger. (C) Photograph of the sensor mounted on a human forearm while the skin is under torsion. The sensor is secured to the skin with Tegaderm film overlaying the device. (D) Photograph of the sensor mounted on the shin with Tegaderm film placed over the device. (E) Photograph of the sensor mounted on the face without the assistance of external adhesives. (F) Photograph of the sensor mounted on the knuckle. The sensor is secured to the skin using Tegaderm film. (G) Photograph of the sensor mounted on the antecubital fossa without external adhesives and corresponding NFC readout of the sensor response displayed on a smartphone, providing a visual of the actual measurement procedure. Photo credit: Surabhi R. Madhvapathy, Northwestern University.
The resulting hydration sensors are flexible, thin (~2.1 mm), lightweight (~2.5 g), and have small lateral dimensions (~4.5 cm by 3.1 cm) (Fig. 1, B and C), enabling gentle yet intimate contact with the surface of the skin for application on nearly any region of the body, including challenging areas such as the shin, face, and even the knuckles (Fig. 1, D to F). The SHS wirelessly receives power from and communicates with any standard smartphone that has near-field communication (NFC) capabilities (Fig. 1G), thereby eliminating the need for a battery and allowing for a compact form factor. This collection of features suggests the potential for widespread use, not only in clinical and laboratory settings but also in the home or office. An easy-to-use, custom software application runs on the phone as an interface to allow patients to monitor their skin health and share data with their physician.
A detailed circuit diagram for the f-PCB electronics appears in Fig. 2A. Accurate measurements require relatively high levels of heating power (~10 to 60 mW) (7). The transmission coil of the smartphone serves as the primary 13.56-MHz (standard NFC frequency) antenna. The sensor design reported here involves separate power-harvesting coil antennas for the heating- and temperature-sensing circuits, in a concentric geometry (Fig. 2, A to C). The secondary antenna 1 (Ant. 1), tuned to 13.56 MHz, connects to the radio frequency (RF) microcontroller (μC) for powering the sensing circuit and for communicating data to the phone using NFC protocols. The secondary antenna 2 (Ant. 2), tuned to 19.04 MHz to prevent interference with Ant. 1, powers the heater (Fig. 2C). The quality factor (Q) of Ant. 1 is relatively high (~11) to enable good communication distance and coupling across phones with different primary antennae. The Q for Ant. 2 is relatively low (~8) to support adequate power harvesting despite the difference between its resonance frequency and that of the primary coil. Detailed antenna characteristics and computational results on the interference between the two antennas are in fig. S2. Rectification and subsequent regulation of the harvested voltage from Ant. 2 produce a constant 3.3-V voltage source for the heater. For a wide variety of smartphones, the root-mean-square (RMS) voltage harvested from Ant. 2 (Vrms) is greater than the threshold voltage (Vthreshold) required for stable voltage regulator operation (Fig. 2D). Thus, the dual-coil powering scheme supports compatibility across a wide variety of smartphones.

(A) Circuit diagram of the device and wireless pairing with a smart phone. A screenshot of a completed NFC readout from the device on the smart phone. ADC, analog-to-digital converter; GPIO, general purpose input/output; EN, enable; GND, ground. (B) Photograph of a fully assembled f-PCB for the device. Component 1 corresponds to a 13.56-MHz antenna used for powering of the radio frequency (RF) microcontroller (μC), sensing circuit, and communication; component 2 is the 19.04-MHz antenna used to deliver a constant q = 10 mW/mm2 of thermal power to the heater; component 3 is the voltage regulator; component 4 is the RF μC; and component 5 is the instrumentation amplifier from the circuit diagram in (A). A microscope image of the heater and the NTC thermistor are shown in a subset of the image. Scale bar, 1 mm. (C) Frequency sweep of the phase angle recorded from an impedance analyzer displaying the peak resonant frequency of the two antennas. The Q factor of each antenna is noted above its corresponding resonant peak. (D) Root-mean-square (RMS) rectified voltage from Ant. 2 recorded across several different smartphone readers. The dotted line indicates the minimum RMS voltage (Vthreshold) for reliable operation. (E) Infrared camera image of the heater and sensor when the heater is off and after the heater is on. (F) Representative transient temperature (ΔT) response generated by a single sensor (n = 1) on four different substrate materials: water (k = 0.6 W/m-K), S170 (k = 0.4 W/m-K), S184 (k = 0.2 W/m-K), and air (k = 0.02 W/m-K). (G) Box plots of ΔT at t = 13 s normalized to ΔT for water at t = 13 s as measured by n = 6 sensors (measured five times each) on the same four materials as in (F). Photo credit: Surabhi R. Madhvapathy, Northwestern University.
The sensing component comprises two commercial surface-mount (SMT) thin film resistors (R = 680 ± 3.4 ohms each) connected in series to form a heater (~0.9 × 0.9 mm2) and an SMT negative temperature coefficient thermistor, placed 60 μm laterally away from the heater (Fig. 2B, subset). The heater can be switched on and off (see infrared camera image; Fig. 2E) by the μC. The change in temperature of the thermistor is captured by the analog-to-digital converter (ADC) of the μC and transmitted to the phone. Details of circuit operation and data transfer are in Materials and Methods. A bill of materials for all electronic components appears in table S1. The dynamic temperature range of the device is ~23° to 38°C, adjustable through the amplifier gain, with a minimum resolution of ~15 mK, limited by the ADC. Control experiments that use a wired system for power and data acquisition yield data that are indistinguishable from those captured using the NFC wireless system introduced here (fig. S2). As further validation, the SHS output for ΔT versus time (t) on standard materials with known k produces the expected, qualitatively inverse relationship between ΔT and k (Fig. 2F) (11). SHS measurements are calibrated against the ΔT versus t curve for water (which has known k = 0.6 W-K, α = 0.14 mm2/s). The results of measurements performed using n = 6 different sensors (5× each) with the same standard materials as shown in Fig. 2F appear normalized relative to the average measurement value for water at t = 13 s in Fig. 2G. Measurements of ΔT for a single device are highly repeatable, with an error of only ±2% (possible sources of variability are in fig. S2). Measurements of ΔT on curved substrates confirm that the device remains largely unaffected by mechanical deformation (fig. S3).
The sensitivity of the SHS (i.e., the range of ΔT for materials across the span of physiological values of k) depends, in part, on the fraction of the generated thermal power that passes through the sample of interest. Ideally, the thermal properties of the sample will dominate the response, ΔT. Alternate paths of thermal transport/thermal sinking, namely, those that can occur within the device itself, reduce the sensitivity to the sample. Associated techniques to improve sensitivity include reducing the widths and thicknesses of interconnect metal (Cu) traces in the vicinity of the heater/thermistor, reducing the thickness of the adhesive, and increasing the thermal power density (fig. S4). Sensor geometry can also alter measurement sensitivity; however, because of the small (~60 μm) spacing between the heater and thermistor, there is negligible difference in sensitivity between the case of a single component serving as both the heater and the thermistor and the separated heater/thermistor structure (fig. S5 and note S2). The distance between the heater and thermistor as well as the total measurement time determine the maximum measurement depth, which, for the configuration reported here, is ~1 mm (see note S2 and fig. S6 for details). Increasing the heater size and measurement time beyond the maximum of 13 s as is used in this work increases the measurement depth [~6-mm depth experimentally achieved in (7)].
Measuring skin water content
In previous reports, fitting procedures based on finite element analysis (FEA) and measurements of ΔT versus t define local, volumetric-averaged values of k for the sample under test, appropriate for homogeneous, isotropic materials (Fig. 2, F and G) (7, 9, 12, 13). Skin, however, is a layered structure that includes different features and heterogeneities. The outermost layer (i.e., the epidermis and its surface coating, known as the stratum corneum) contains water embedded within cells and in the tissue matrix. The dermis, the layer beneath the epidermis, contains this form of water as well as that associated with blood vessels (Fig. 3A). Modeling the skin as a two-layer system enables extraction of the averaged thermal properties of the epidermis and dermis, separately. FEA simulations relate the SHS measurements (ΔT versus t) to the thermal properties of skin. A micromechanics model treating the skin as a composite of dry tissue and water relates the thermal properties directly to the skin water content (φ) (Fig. 3B). The FEA model assumes a thickness h for the epidermis (based on body location; table S2), with an approximate value of ≈100 μm for most locations except for acral surfaces such as the heel (h ≈ 600 μm) and palm (14). At the microscale, the model for the epidermis consists of a composite of dry skin [kdry = 0.2 W/(m-K), αdry = 0.15 mm2/s] and water [kW = 0.6 W/(m-K), αW = 0.14 mm2/s] (12, 15). In this way, the equivalent thermal properties of the epidermis can be related to the volumetric epidermal water content φE according to(1)(2)where , as plotted in fig. S7, and kE and αE correspond to the thermal conductivity and diffusivity of the epidermis, respectively. A similar simple model applies to the dermis, such that its equivalent thermal properties are given in Eqs. 1 and 2 with kE, αE, and φE replaced by kD, αD, and φD, respectively.

(A) Pictorial diagram of the structure of skin. The parameter h represents thickness of the epidermis. Certain important features are noted in the diagram: (1) sebaceous glands, (2) eccrine sweat glands, and (3) blood vessels. (B) Workflow diagram illustrating the procedure for FEA fitting of epidermal hydration level φE (%) and dermal hydration level φD (%) from the measured ΔT versus time curve. (C) Cross-sectional view of the temperature distribution induced by the heater on the skin at short time (t = 2 s) and (D) long time (t = 13 s). (E) Relationship of the ΔT at short times (t = 2 s) to φE and φD. (F) Relationship of the ΔT at long times (t = 13 s) to φE and φD. (G) Violin plots of φE and φD for six different body locations (npatients = 16). Values for φD are not shown for the heel because of the large value of h (~600 μm).
At the macroscale, FEA (see Materials and Methods for details) establishes a relationship between ΔT (at time t = 0 to 13 s) and the thermal properties kE, αE, kD, and αD, and, therefore, the water content φE and φD. For the typical epidermal thickness (h = 100 μm), at short times following initiation of heating (e.g., t = 2 s), thermal transport occurs substantially into the epidermis but only slightly into the dermis (Fig. 3C). Under these circumstances, ΔT is much more sensitive to φE than φD (Fig. 3E). Conversely, at long times (e.g., t = 13 s), the heat passes through the epidermis and considerably into the dermis (Fig. 3D). As the dermis is much thicker than the epidermis, ΔT in this regime is much more sensitive to φD than φE (Fig. 3F). This temporal separation allows separate determination of φE and φD from the ΔT versus t curves (see note S3 for details), thereby enabling real-time display of φE and φD on the phone application shortly after completing the measurement. For a few cases, depending on the individual and the body location, large epidermal thicknesses (e.g., heel, h ~ 600 μm) limit the transport of heat to the dermis even at t = 13 s. This behavior leads to a relative insensitivity of ΔT to φD (fig. S8), such that φD is indeterminate (14). In practice, for the cases reported here, errors in the values of φE and φD determined in this manner are <5% (fig. S9 and note S4). The main contributions to these errors are in the noise associated with the measurement of ΔT (< 3%) and in variations in h (<20%; note S4 and fig. S9). Measurements on a benchtop model consisting of mixtures of glycerin and water, prepared to span a wide range of physiologically relevant values of k, agree well with results from the FEA model developed here (fig. S4).
Measurements on several healthy/normal participants (npatients = 16, demographics in table S3) on six different body locations each illustrate the accuracy of the fitting process and utility of the model (Fig. 3G; FEA fits with error values in fig. S10). φE has a larger variance than φD across the various body locations, attributed to the direct exposure of the epidermis to the environment and insulation of the dermis from environmental conditions. Furthermore, φE for the forehead and cheek show greater variations than that of other body locations, likely due to the presence of sebum, an oily, waxy substance excreted by sebaceous glands (with highest density on the face and scalp) largely comprising triglycerides, fatty acids, and wax esters, all which exhibit relatively low k [0.13 to 0.2 W/(m-K)] (16–19). Measurements across the various body locations yield a combined, average water content (including both φE and φD) for local areas (sans the heel) on healthy/normal participants of ~63%, consistent with the literature (6, 20). Typically, φD > φE (P = 0.0009, nlocations = 79; refer to Materials and Methods), as expected due to transepidermal water loss (TEWL) in the epidermis and the presence of blood vessels in the dermis. This finding agrees with reports in literature, which show lower average values of water content in the epidermis (~25 to 70%) than in the dermis (~70%) (21). These results validate that the model for skin hydration developed here is consistent with known skin physiology.
Measurements on patients with AD
Use of the SHS on patients diagnosed with various skin diseases yields a key set of results that illustrate the clinical utility and the versatility of the technology. For assessments of disease lesions, φE and φD, along with skin surface temperature T0 are important indicators of different conditions, such as edema and erythema. We note that calculations of φE and φD involve measurements of ΔT and are thus independent of T0. The same types of information can also serve as quantitative metrics of the efficacy of treatment strategies, for example, moisturizers/ointments. These combined features aid in diagnosis, treatment response tracking, and potential detection of flares. The following results also compare measurements of the SHS with those of a commercially available, portable moisture meter (gpskin barrier pro, GPower Inc., Korea) that determines both transepidermal water loss (TEWL; a contactless measurement using humidity and temperature sensors) and stratum corneum hydration (ScH; an electrical impedance/capacitive measurement), and shows good correlation to clinical gold standard Tewameter® and Corneometer® devices (22, 23). TEWL is a complementary measurement to skin hydration and assesses skin barrier function (6). We note that the aforementioned commercial skin impedance/capacitance-based devices typically involve only superficial measurement depths, confined to the stratum corneum (~15 μm) (24). Few devices have millimeter-scale measurement depths but have large (1 to 5 cm) probe diameters, which prevent small-area measurements (25).
The first demonstration focuses on patients with AD, an inflammatory disease of the skin that causes red, itchy rashes on various locations of the body. In the United States, 18 million adults suffer from AD, with worldwide prevalence rates of 1 to 20% (26, 27). This pilot study involves nlesion = 13 lesions across npatient = 7 patients clinically diagnosed with AD by a dermatologist using both the SHS and the moisture meter. Patient demographics appear in table S4. SHS outputs consist of measurements of T0, φE,L(N), and φD,L(N) on the diseased site (the lesion L) and on healthy-looking skin on a similar body location or perilesional area (nonlesional area N) as a standard of comparison. T0 and moisture meter data for lesions in Fig. 4, not displayed in Fig. 4 for brevity, are in fig. S11. Results for all remaining lesions are in fig. S12. Three patients with chronic AD (Fig. 4, A to D) display low values of φE,L (<20%) compared with the nonlesional sites, consistent with the clinically dry appearances of the lesions. For the patients in Fig. 4 (A and B), the φD,L is also much lower at the site of the lesion than φD,N. Instances where φD,L < φD,N suggest that layers of skin below 100 μm are also drier than normal skin. A possible explanation is that the epidermis is thicker than the assumed value of 100 μm, attributed to hyperkeratosis. Figure 4 (E to H) displays images of acute AD lesions and their corresponding φE and φD. φE,L at the lesion is on average ~20% lower than φE,N (P = 0.0034). φD and T0 do not display significant differences between the lesional and nonlesional sites (Fig. 4, I to K). These results are consistent with the understanding that AD is an epidermal disease. In contrast, data obtained with the moisture meter present no clear demarcation between diseased and nonlesional locations for ScH (P = 0.1099), but measurements of TEWL (P = 0.00024) (fig. S13) exhibit indications of the disease.

φ for the epidermis (light gray bars) and dermis (dark gray bars), and photographic image of the lesion and nonlesional areas for patients with (A to D) chronic AD lesions and (E to H) acute AD lesions. Measurements involved n = 7 patients and n = 13 lesions. Data for the lesions not displayed here are in fig. S11. Dots embedded in the images represent exact measurement locations. Gray lines between plots for φ and corresponding images demarcate different patients. Error bars represent the SDs of three measurements repeated consecutively on the body location. In the absence of perilesional areas of skin with normal appearance, the contralateral location served as a comparison. (I) Histogram highlighting the difference between the nonlesional epidermal hydration (φE,N) and the lesional epidermal hydration (φE,L) for all n = 13 lesions. (J) Histogram highlighting the difference between the nonlesional dermal hydration (φD,N) and the lesional dermal hydration (φD,L) for all n = 13 lesions. (K) Histogram highlighting the difference in nonlesional skin surface temperature (T0,N) and lesional skin surface temperature (T0,L) for all n = 13 lesions. Computed two-sided P values using the Wilcoxon signed-rank test is displayed above each histogram. Photo credit: Michael Zhang, Vanderbilt University, and Surabhi R. Madhvapathy, Northwestern University.
Measurements on patients with psoriasis and urticaria
Additional clinical studies use SHS to measure φE, φD, and T0 (see FEA curve fits in fig. S14, and fig. S15 for T0 and moisture meter data) for nlesion = 7 lesions across npatient = 3 patients with psoriasis—a skin disease characterized by a thickened epidermis and sanguineous, scaly, plaques affecting >8 million people in the United States (28, 29). For the psoriasis lesions presented in Fig. 5 (A to D), both φE,L and φE,N exhibit low values. As with certain patients with AD, φD,L < φD,N again suggest a thickening of the epidermis, which in the corresponding images appears as white, flaking skin. In other cases (fig. S13), φD,L is much larger than φD,N. Here, the lesions have a deep red color without the presence of peeling skin, suggesting a younger lesion with a thinner epidermis than the lesions in Fig. 5 (A to D). The color suggests elevated blood flow in the dermis. Hence, for older lesions, the SHS response is likely insensitive to this flow, whereas the sensitivity should be comparatively higher for younger lesions with relatively thinner epidermis. The value of φD, therefore, may lend insight into the age of psoriasis lesions, but this possibility merits further investigation on a larger number of patients. Of additional note are two unique cases of acral psoriasis (Fig. 5D and fig. S12), where φE,L < φE,N, consistent with the flaky dehydrated appearance of the lesion compared with the perilesional location. The SHS can differentiate between psoriasis lesions and nonlesional areas with φE (P = 0.0156). By contrast, differences in φD (P = 0.8125) and T0 (P = 0.0781) are insignificant, confirming that psoriasis is an epidermal disease (Fig. 5, E to G). Measurements with the moisture meter also show some differences between the lesion and nonlesional areas (P = 0.0156 for both ScH and TEWL) (figs. S13 and S16).

φ for the epidermis (light gray bars) and dermis (dark gray bars), and photographic image of the lesion and nonlesional areas for patients with (A to D) psoriasis. Measurements involved n = 3 patients and n = 7 lesions. Histogram highlighting the difference between (E) the nonlesional epidermal hydration (φE,N) and the lesional epidermal hydration (φE,L), (F) the nonlesional dermal hydration (φD,N) and the lesional dermal hydration (φD,L), and (G) the nonlesional skin surface temperature (T0,N) and lesional skin surface temperature (T0,L) for all n = 7 lesions. (H to K) Hydration level and photographic image of the lesion and nonlesional areas for patients with urticaria. Measurements involved n = 2 patients and n = 4 lesions. Histogram highlighting the difference between (L) φE,N and φE,L, (M) φD,N and φD,L, and (N) T0,N and T0,L for all n = 4 lesions. Computed two-sided P values using the Wilcoxon signed-rank t test is displayed above each histogram. Photo credit: Michael Zhang, Vanderbilt University, and Surabhi R. Madhvapathy, Northwestern University.
The SHS can also provide insights into dermal diseases owing to its capability to measure properties deep into the skin, through measurements performed on patients with urticaria. This condition occurs in the epidermis and the upper portions of the dermis, where localized vasodilation occurs and biofluid exudes into the surrounding tissue (30). Measurements on npatient = 2 patients for a total of nlesion = 4 urticaria lesions indicate enhanced water content in the lesion than in the nonlesional area for both the epidermis and dermis (Fig. 5, H to M). The values of T0 for all four lesions, furthermore, are consistently larger than those of the corresponding normal location, suggesting an expected enhancement of microvascular blood flow in the dermis of the lesions (Fig. 5N). Similar trends in T0 also appear in lesions associated with a patient with a different dermal disease, rosacea (fig. S12). Because of the relatively small sample size, P is insignificant. The moisture meter exhibits no trend because of its shallow measurement depth (fig. S13). This collection of studies highlights the utility of SHS in assessing hydration across a broad range of skin diseases, with insights that extend beyond the superficial layers of skin compared with traditional skin impedance/TEWL–based devices. These findings correlate well with expected histopathology findings of both psoriasis and urticaria. The results demonstrate that the SHS can detect parameters that may serve as disease signatures—characteristic, disease-specific, quantitative trends in φE, φD, and/or T0—for accurate, quantitative monitoring and detection of diverse dermatological conditions.
Topical treatment on a patient with xerosis cutis and AD
Diagnosing a disease state represents the first step in patient care. The next involves delivering treatment, monitoring the effects, modulating the treatment protocol as necessary, and potentially predicting for flares based on quantitative, individualized measurements on specific lesion sites. The results in the following demonstrate this approach in the context of a topical cream (CeraVe Moisturizing Cream, DFB Technology Ltd., USA) applied to a patient diagnosed with both xerosis cutis and AD.
Measurements with the SHS indicate that for both xerosis cutis lesions on the anterior leg, application of moisturizer for 30 min improves φE from its low initial value (+10 to 30%) but does not affect φD, as expected because moisturizers only improve superficial skin hydration (Fig. 6, A and B) (6). Photographs of the left leg of the participant before and after application of moisturizer visibly illustrate the improvement in hydration of the epidermis (Fig. 6C). Measurements of φ on the normal skin of the forehead before and after application of the moisturizer show negligible differences, as the skin of the forehead has high baseline hydration levels and a visually hydrated appearance (Fig. 6, D and E).

(A and B) φ for the epidermis (light gray bars) and dermis (dark gray bars) of the lesion on both legs of a patient with xerosis cutis before and 30 min after application of moisturizing cream to the skin. Dots embedded in the images represent exact measurement locations. The region of the graph shaded in orange represents the data after application of moisturizer. Error bars indicate measurements repeated three times consecutively on the same location. (C) Photograph of the lesion on the right leg of the patient corresponding to the data in (A) before and 30 min after application of moisturizer. (D) φ for the epidermis and dermis on the normal skin of the forehead before and 30 min after application of moisturizer to the skin. No lesions were present on the forehead for this patient. (E) Photograph of the forehead of the patient before application of moisturizer. (F to K) φ for the epidermis and dermis and corresponding images on the AD lesion and nonlesional areas for the same patient on three different body locations before and 30 min after application of moisturizer. In (F) to (K), no post-moisturizer photographs were recorded. Photo credit: Michael Zhang, Vanderbilt University.
The acute AD lesions on the elbow, wrist, and antecubital fossa exhibit no increase in φE,L with moisturizer and negligible change in φD,L (Fig. 6, F to K). Results from a second patient treated with the same moisturizer on two AD lesions also indicate no observable changes in φE,L or φE,N (fig. S17). Because of the weeping nature of these acute AD lesions and because φE or φD indicates negligible differences between the lesion and nonlesional areas, this topical cream may not prove effective in improving the disease symptoms. Even for the same patient, moisturizer is effective only for certain diseases and locations. An important feature of the SHS measurement is that it probes deeply into the skin and can thus assess φ of the entire epidermis. In contrast, the moisture meter, as with other skin impedance/capacitance–based devices, has a shallow measurement depth, where measurements can be heavily influenced by the water content associated with residual moisturizer on the skin, not the skin itself. The SHS thus demonstrates potential in not only assisting in the diagnosis of skin disease but also in determining the effectiveness of topical and systemic treatments.
DISCUSSION
Thin, soft, wireless SHSs developed in this work exhibit high repeatability in measurements, robust operation in various conditions, and, through careful systems engineering, overcome the shortcomings of technologies introduced in previous works. The robust design has enabled the first true application of well-known thermal physics and the TPS technique in actual clinical/nonclinical settings under varied real-world conditions for several patients over multiple body locations. The feature of wireless data transmission and use with a wide range of mobile devices facilitates use in assisting patients with quantitative tracking of their skin health and sharing these data with their physicians. The designs specifically align with commercial manufacturing capacity that supports the consumer electronics industry, thus allowing for low-cost production and broad distribution to both clinicians and patients. This work thus has the potential to create opportunities for measurements not formerly achievable on patients in clinical environments and in the home.
Measurement areas have millimeter-scale dimensions, allowing detection and mapping of small lesions on the skin, even on challenging and/or sensitive regions of the body. The measurement depths can reach ~1 mm, and the temporal information allows discrimination between surface and deep skin properties from a single set of time series data. The contact to the skin occurs naturally or can be paired with external medical-grade adhesives, without need for control over application pressure. These three features are absent from conventional skin impedance/capacitance-based devices such as the Corneometer®. Furthermore, the device offers superior measurement capabilities, with average repeatability error of 5% for φE and 4% for φD. As comparison, the average errors for TEWL and ScH from the commercial moisture meter are 14.4% and 30.1%, respectively.
A limitation of the measurement is that the thickness of the epidermis is typically not known, and it cannot be easily inferred directly from the thermal data. For healthy/normal participants, the literature values represent fair assumptions, as small variations in thickness do not alter fitting results appreciably. On the other hand, for diseased locations, the thickness can change markedly. While in these cases the top ~100 μm may not necessarily represent the “epidermis,” the hydration values of the top 100 μm of skin and remaining ~900 μm below are accurate and serve the need for skin diagnostics. Paired with visual inspection, and as seen in measurements on patients with visible skin thickening, the device may yield signatures for lesions with different skin thickness. Determining signatures for each disease and subtype warrants, however, careful investigation on many patients. Procedures include characterizing the difference between lesions and nonlesional areas, acute and chronic conditions, different subject populations, and response to treatments. The scope of the SHS platform can also be extended to monitor water content of internal organs for various diseases where traditional monitoring techniques (blood tests, MRI, etc.) fail to offer continuous assessment of organ health.
Ultimately, the technology presented here allows monitoring of skin health anywhere, anytime, and by anyone. The SHS has the potential for use in both clinical and at-home settings, from its ability to discern AD lesions (P = 0.0034) and psoriasis lesions (P = 0.0156) with high significance, detect trends for dermal diseases like urticaria and rocasea, and assess treatment efficacy. Capabilities for determining changes in skin water content present an important benefit across the entire continuum of care for inflammatory skin diseases. This soft, conformal, battery-free system device may provide valuable perspectives on skin diseases and continuous monitoring of skin health.
MATERIALS AND METHODS
Study design
The objectives of this study were to design and demonstrate a robust, wireless, battery-free, and soft sensor for widespread, noninvasive monitoring of skin hydration independent of clinical settings, and to validate their performance against clinical standard tools. Patients recruited received full informed consent (Ann & Robert H. Lurie Children’s Hospital of Chicago, Chicago, IL; institutional review board study #STU00209010). Inclusion criteria specified healthy/normal participants or patients undergoing evaluation or routine checkups for clinical skin-related pathologies. A hypoallergenic silicone-based surgical tape (Kind Removal Silicone Tape, 3M Inc., USA) assisted in adhering the device to the skin. Sterilization of the moisture meters and SHS required individual wiping down of all surfaces with single-use alcohol wipes (Sterile Alcohol Prep Pads, Dynarex Corp., USA).
Patients with disease. The sensor recorded measurements in triplicate on identified lesions, perilesional locations, or unaffected contralateral locations if no perilesional area with a normal appearance was available. A waiting period of 30 s after application of the device to skin and between measurements ensured the sensing components achieved thermal equilibrium with the temperature of the skin. Moisture meter readings (gpskin Barrier, GPower Inc., Korea) taken in triplicate on the same corresponding sites served as a metric for comparison to the measurements taken by the SHS.
Patients with healthy/normal skin. Measurements using the SHS device were only performed once on each body location to imitate a real-life use case. Body locations selected for studies on healthy/normal participants included the forehead, cheek, volar forearm, shin, calf, and heel. Measurements were not performed in cases with presence of excessive hair at the measurement site or for those who had applied moisturizer to that region of skin. A hypoallergenic silicone-based surgical tape (Kind Removal Silicone Tape, 3M Inc., USA) assisted in adhering the device to the skin. Sterilization of the moisture meters and SHS required individual wiping down all surfaces with single-use alcohol wipes (Sterile Alcohol Prep Pads, Dynarex Corp., USA).
Fabrication of SHSs
Initial prototypes and proof-of-concept devices involved use of a laser cutter (LPKF U4, LPKF Inc., DE) to pattern a double-sided copper-clad laminate (Pyralux AP8535R, DuPont Inc., USA) and standard microsoldering techniques. To avoid damage to the critical sensing components, soldering the thermistor (NTCG063JF103FT, TDK Corporation, Japan) and heater resistors (RR0306P-681-D, Susumu Co. Ltd., Japan) using a low-temperature solder paste (TS391AX10, Chip Quik Inc., USA) and heat gun temperature of 200°C for less than 5 s was the final step in component assembly. Initial devices were prototyped in a laboratory setting, and the final designs were then sent to an external ISO-9001-compliant vendor for full manufacturing and assembly of multiple f-PCBs to illustrate the compatibility with readily available outsource manufacturing techniques. Programming the μC (RF430FRL152H, Texas Instruments Inc., USA) with a custom-designed embedded code using an NFC read/write interface (TRF7970AEVM, Texas Instruments Inc., USA) allowed for wireless communication of the sensor to a custom smartphone application. This software application features tunable measurement time and custom file naming.
Encapsulation of SHSs
The detailed fabrication procedures appear in the Supplementary Materials (fig. S1 and note S1). Briefly, preparing a layered structure of 45-μm thickness of silicone (Ecoflex 00-30, Smooth-On Inc., USA)/silicone gel (Ecoflex gel, Smooth-On Inc., USA), 30-μm-thin fiberglass fabric, followed by an additional 45-μm-thin silicone/silicone gel on a glass slide yielded the bottom layer of the SHS device, as the direct interface between the f-PCB and the skin. The f-PCB adhered to the silicone layer via bonding between a thin coating of SiO2 sputter deposited onto the backside of the f-PCB and dangling ─OH bonds on the surface of the silicone (formed through ultraviolet-light functionalization). A custom-made aluminum mold and a hot press (Carver Press, Carver Inc., USA) allowed formation of a structured film of silicone (~2.7-mm thickness) as the top shell of the device. Screen printing uncured silicone beyond the outermost border of the f-PCB, placing the top shell and bottom layer together and subsequently curing of the entire device on a hotplate at 70°C for 10 min sealed the system. Cutting the completed structure out in a teardrop shape using a die cutter and peeling the structure off the glass slide completed the fabrication process.
Data collection and analysis
Powering the heater occurs through a regulated DC supply at a voltage of 3.3 V derived from the secondary AC voltage at Ant. 2, resulting in a constant thermal power of q = 10 mW/mm2. The resistance of the heating element remains nearly constant due to its low temperature coefficient of resistance = 25 parts per million/°C. The thermistor connects as one of the arms of a Wheatstone bridge powered by a rectified 2.1 V from the RF μC. The voltage across the arms of the Wheatstone bridge is amplified, subsequently read by the RF μC ADC (sampling rate, 1 Hz; resolution, 10 bits), then transmitted to the phone (data rate, 0.125 Hz) NFC ISO15693 reader, and lastly recorded in the phone’s memory and also displayed on the screen. The application supports to the use of Android phones with NFC capability. The relationship between bit values and T appears in note S5.
Finite element analysis
FEA was performed using the commercial software ABAQUS. As shown in fig. S18, the model consists of all parts of the device related to the transfer including heater, thermistor, copper wires, PI substrate, Ecoflex adhesive, and measurement sample (epidermis and dermis). The air gap on top of the device is modeled by the adiabatic boundary condition at the top surface. A refined mesh much smaller than the finest feature size of the device (18 μm, copper thickness) was adopted to guarantee simulation convergence and accuracy. The material parameters used in all simulations are kcopper = 377 W/(m-K), αcopper = 109 mm2/s, kPI = 0.12 W/(m-K), αPI = 0.078 mm2/s, kEcoflex = 0.21 W/(m-K), and αEcoflex = 0.091 mm2/s, with k and α standing for thermal conductivity and thermal diffusivity, respectively (15, 31). FEA simulations on the influence of environmental temperature/humidity on the device appear in fig. S19.
Statistical analysis
All P values correspond to a two-sided Wilcoxon signed-rank test with the null hypothesis H0 = N − L = 0. Error bars in various data plots indicate the SDs over three consecutive trials on the substrate/skin. Participants with dense coverage of hair and those who applied moisturizer were omitted from the data on healthy/normal participants in Fig. 3F.
Acknowledgements: We thank A. Bugler and C. Gong for help with the graphical user interface of the cell phone application, and E. Rock, F. Lantz, and S. Rodriguez for assistance in the machine shop. S.R.M. thanks S. Yun Heo for the useful comments and discussions. Funding: S.R.M. acknowledges support from the NSF Graduate Research Fellowship (NSF DGE-1842165). Z.X. acknowledges support from the National Natural Science Foundation of China [grant no. 12072057] and the Fundamental Research Funds for the Central Universities [grant no. DUT20RC(3)032]. R.A. acknowledges support from the NSF Graduate Research Fellowship (NSF DGE-1842165) and Ford Foundation Predoctoral Fellowship. Y.H. acknowledges support from the NSF (CMMI1635443). This work used the Northwestern University Micro/Nano Fabrication Facility (NUFAB), which is partially supported by Soft and Hybrid Nanotechnology Experimental (SHyNE) Resource (NSF ECCS-1542205), the Materials Research Science and Engineering Center (DMR-1720139), the State of Illinois, and Northwestern University. Author contributions: S.R.M., H.W., A.B., S.X., Y.H., and J.A.R. conceived the ideas, concepts, and design of experiments and analyzed the results. S.R.M. performed engineering investigations, with support from J.K., H.J., J.C., V.D., J.Z., H.U.C., S.C., M.P., and J.W., and H.W., Z.X., R.A., and C.W. performed theoretical investigations. S.R.M., J.Y.L., and J.B.P. developed the software. J.L. is a part of hydration related studies at the Querrey Simpson Institute for Bioelectronics. S.X. provided clinical evaluations/diagnosis on patients with skin conditions. S.R.M. and M.Z. performed skin hydration/moisture meter measurements in the hospital clinic. S.R.M., H.W., S.X., and J.A.R. wrote the paper. Competing interests: J.A.R. and A.B. are cofounders of a company with commercial interests in forms of technology related to the one described here. A provisional patent has been filed by J.A.R., Northwestern University, patent number 63/092,555. The other authors declare that they have no competing interests. Data and materials availability: All skin hydration data associated with this study are present in the paper and/or the Supplementary Materials. Additional data related to this paper may be requested from the authors.