


Transmission line losses are the conversion of RF power to heat in the conductors and dielectric, plus any radiation, and they grow with both length and frequency. Power handling capacity is the highest power a line can carry before heating damages it on average or voltage breaks it down at the peaks. Loss is calculated from attenuation in dB per metre, and both limits get tighter when the line is mismatched.
This article covers each mechanism and then follows one cable run through the calculations. It assumes the terms from the introduction to transmission line theory and transmission line parameters, and it belongs with the RF fundamentals material.
Sources of transmission line loss
Conductor loss
RF current crowds into a thin layer at the conductor surface. In copper the skin depth is about 2.06 μm at 1 GHz, so only a small part of the metal carries current. Resistance grows with the square root of frequency, and conductor attenuation follows the same law. The skin effect article explains the physics. Surface roughness adds further loss when the skin depth falls to a similar size as the roughness, which is a common concern on PCB copper.
Dielectric loss
The insulation absorbs a little energy in each RF cycle, measured by its loss tangent. For a line entirely filled with dielectric:
αd ≈ 27.3 √εr tan δ / λ0 dB/m
Here λ0 is the free-space wavelength in metres. The attenuation rises linearly with frequency, so dielectric loss takes a larger share as frequency increases. That effect drives much of the choice of PCB substrate above a few GHz.
Radiation and leakage
Open structures can radiate at bends and discontinuities. Microstrip does this more than stripline, and parallel wire does so readily near metal objects. Coax and waveguide radiate little if the shield and joints are sound. Connectors and transitions add loss of their own, normally listed separately from per-metre attenuation.
Calculating attenuation
A cable can be modelled by two terms:
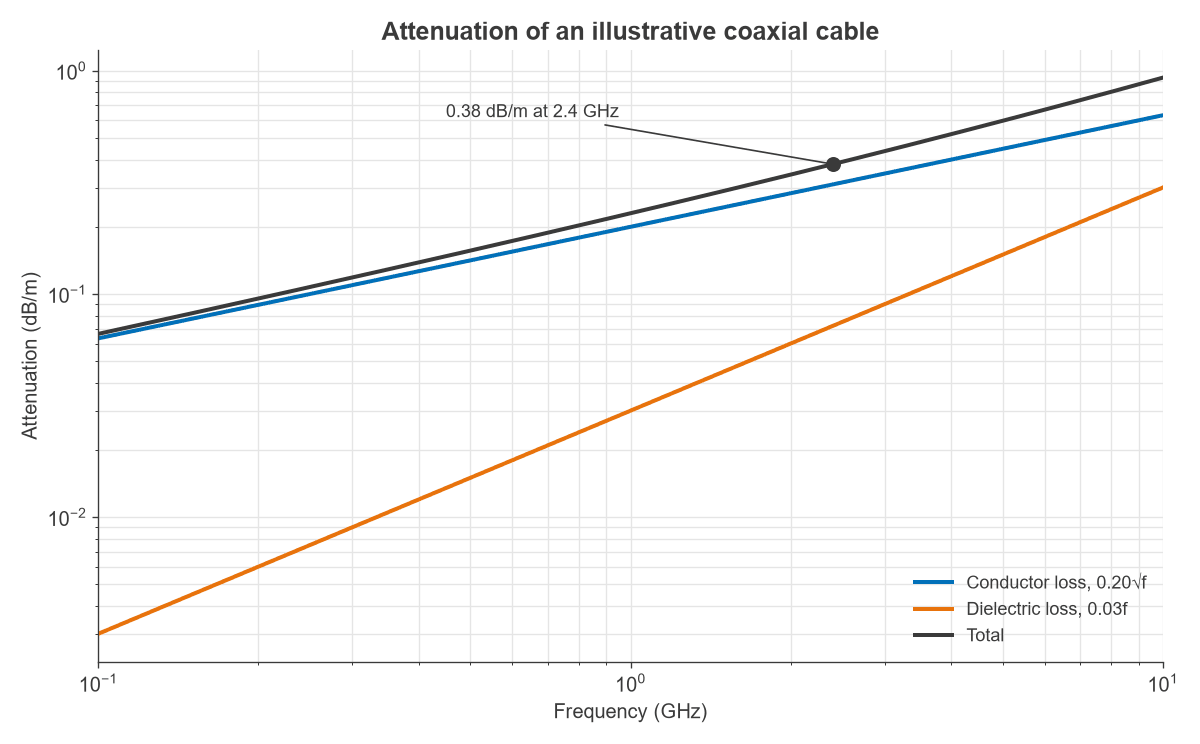
α(f) = k1√f + k2f
where k1 and k2 are fitted to data. The total line loss in dB is α multiplied by length, and the delivered power is:
Pout = Pin × 10−αl/10
Figure 1 shows an illustrative cable with k1 = 0.20 and k2 = 0.03, with f in GHz and α in dB/m. These coefficients are for demonstration, and a real design should use the cable data sheet.
Mismatch adds to line loss
When the load is mismatched, reflected power passes through the line a second time and is attenuated on the way. For a line with matched-line power ratio A = 10−αl/10 and load reflection magnitude |Γ|, the fraction of the power entering the line that reaches the load is:
η = A(1 − |Γ|2) / (1 − |Γ|2A2)
Reflections and their measures are covered in reflection and transmission coefficients and the VSWR and return loss page.
Worked example: a 15 m coaxial run at 2.4 GHz
A transmitter feeds 100 W at 2.4 GHz into 15 m of the cable in Figure 1.
Attenuation and delivered power
- Conductor term: 0.20 × √2.4 = 0.310 dB/m.
- Dielectric term: 0.03 × 2.4 = 0.072 dB/m.
- Total: 0.382 dB/m, or 5.73 dB over 15 m.
- Delivered power: 100 × 10−0.573 = 26.7 W.
- Heat in the cable: 73.3 W.
The heat is not spread evenly. Power is highest at the input, and the first metre alone dissipates 8.4 W. The wave propagation article shows the same decay as the factor e−αz. This end of the cable runs hottest and sets the thermal limit.
Effect of a load VSWR of 1.5
A VSWR of 1.5 corresponds to |Γ| = 0.2. With A = 0.267, the equation above gives η = 0.257, or a total loss of 5.89 dB. The mismatch costs 0.16 dB, and delivered power falls to 25.7 W. A modest mismatch on a lossy line has only a small effect on delivered power.
Peak voltage
For a sine wave in a matched line, Vpeak = √(2PZ0). At 100 W in 50 Ω, this gives 100 V. A VSWR of 1.5 raises the voltage maximum by 1 + |Γ|, to 120 V.
A modulated signal with an 8 dB peak-to-average ratio has a peak envelope power of 631 W at 100 W average, which means 251 V peak, or 301 V with the same mismatch. These figures ignore line loss between source and load, so they are conservative for the standing wave near the load.
Average power handling
Average power is limited by temperature. Dissipated power heats the centre conductor, which sheds heat through the dielectric and shield to the surroundings. The limit is reached when the inner conductor or dielectric hits its maximum temperature. Cable ratings therefore fall with increasing frequency, because loss rises, and they also fall with high ambient temperature, altitude and bundled or enclosed routing.
On a PCB the same reasoning applies at a smaller scale. Trace temperature rise depends on copper width, substrate thermal conductivity and neighbouring heat sources.
Peak power handling
Peak power is limited by voltage. The dielectric, or the air in a connector gap, breaks down when the local field is too high. Corona and arcing can occur at sharp edges and connector interfaces well below the bulk rating of the cable. Short pulses can reach this limit while average power remains low, so pulsed and high-PAPR systems often face this limit first.
Mismatch derating
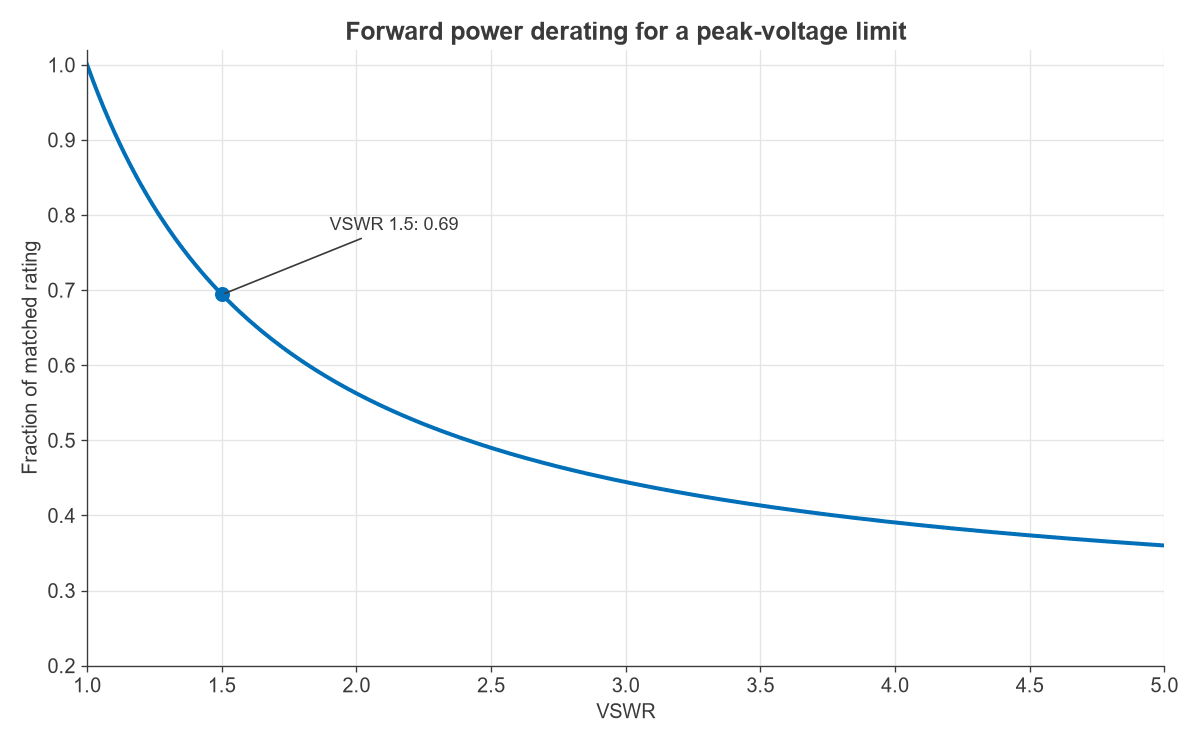
A mismatch raises the voltage maximum by 1 + |Γ|, so forward power should be reduced by:
Derating factor = 1 / (1 + |Γ|)2
At a VSWR of 1.5 this factor is 0.69, as Figure 2 shows. Current maxima raise conductor heating in a similar way, and those points can become local hot spots at high power.
Why 50 Ω: the coaxial trade-off
For a fixed shield diameter, coaxial loss and power handling depend on the ratio D/d. Figure 3 plots three criteria for an air line:
- Lowest attenuation: D/d = 3.59, or 76.7 Ω.
- Highest breakdown voltage: D/d = e, or 60 Ω.
- Highest peak power: D/d = √e, or 30 Ω.
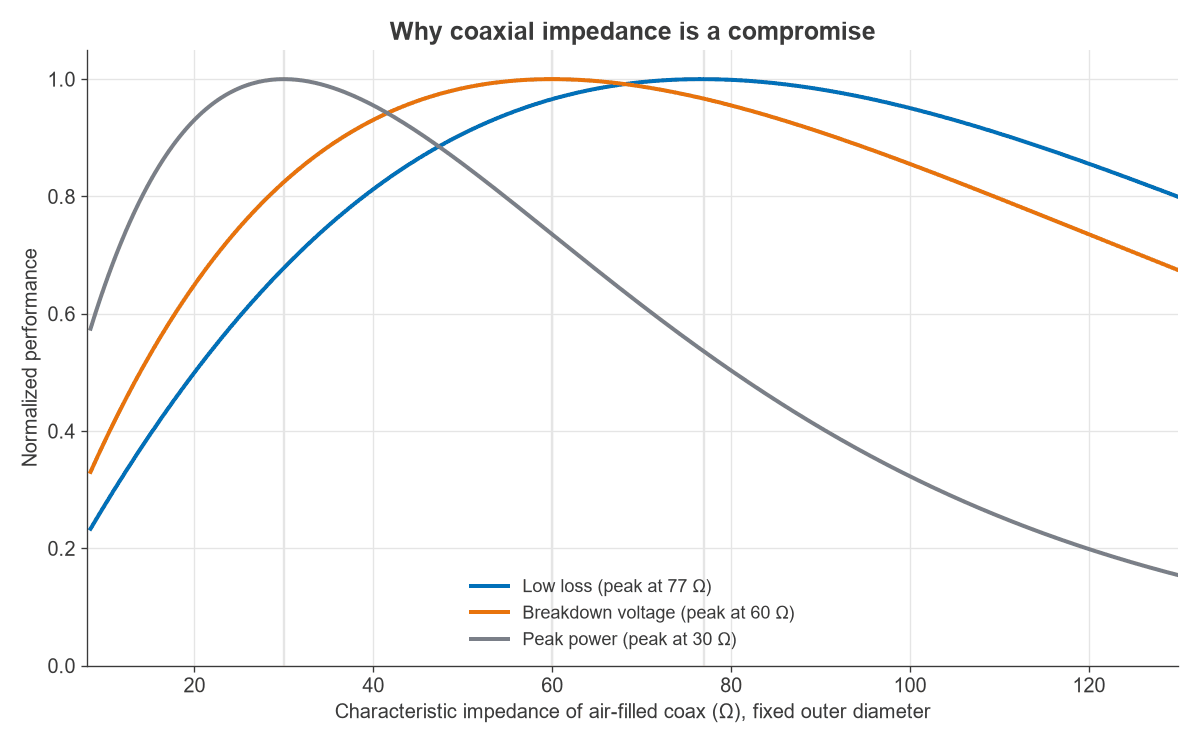
The attenuation curve here considers conductor loss. With solid PTFE the impedances fall by √2.03, to 53.8, 42.1 and 21.0 Ω. The 50 Ω standard sits between these optima. The 75 Ω standard is close to the air-line low-loss figure and suits receive and video systems. Line families such as waveguides avoid the centre conductor entirely, which explains their advantage at high power. The types of transmission lines article compares these in detail.
Frequently asked questions
Why does transmission line loss increase with frequency?
Skin effect raises conductor resistance as √f, and dielectric loss rises in proportion to f. Above some frequency the dielectric term can dominate, depending on the material. Radiation from open lines and discontinuities also grows with frequency.
What limits the power a coaxial cable can carry?
Heat limits average power, and voltage breakdown limits peak power. The rating falls with frequency because attenuation rises. Connectors often set a lower limit than the cable itself.
How much does VSWR add to cable loss?
It depends on line loss and VSWR. In the worked example a VSWR of 1.5 added 0.16 dB to 5.73 dB. The separate question of how a mismatch affects source behaviour and peak voltage can matter more than the added loss.
Should total loss be expressed in dB or as efficiency?
Both are useful. Decibels add along a chain, which suits a link budget, and percentages show directly how much heat must be removed. A 5.73 dB line delivers 26.7 percent of its input and dissipates 73.3 percent.
Related topics
Matching at the end of a run is covered in transmission line terminations, and the measurement of attenuation by a network analyzer in S-parameters.