


The reflection coefficient Γ is the ratio of the reflected voltage wave to the incident voltage wave at a point on a transmission line, and the transmission coefficient τ is the ratio of the transmitted wave to the incident wave. For a load ZL on a line of impedance Z0, Γ = (ZL − Z0)/(ZL + Z0) and τ = 1 + Γ. Both are complex numbers, so they carry magnitude and phase.
This article derives the two coefficients, separates voltage from power, and shows how they relate to the figures engineers measure. It builds on the introduction to transmission line theory and sits within the RF fundamentals material. The Z0 used throughout comes from the line parameters and depends on the type of line.
Deriving the reflection coefficient
At the load, the total voltage is the sum of incident and reflected waves, and the total current is their difference divided by Z0:
VL = V+ + V−
IL = (V+ − V−) / Z0
The load demands VL/IL = ZL. Solving for the ratio V−/V+ gives:
Γ = (ZL − Z0) / (ZL + Z0)
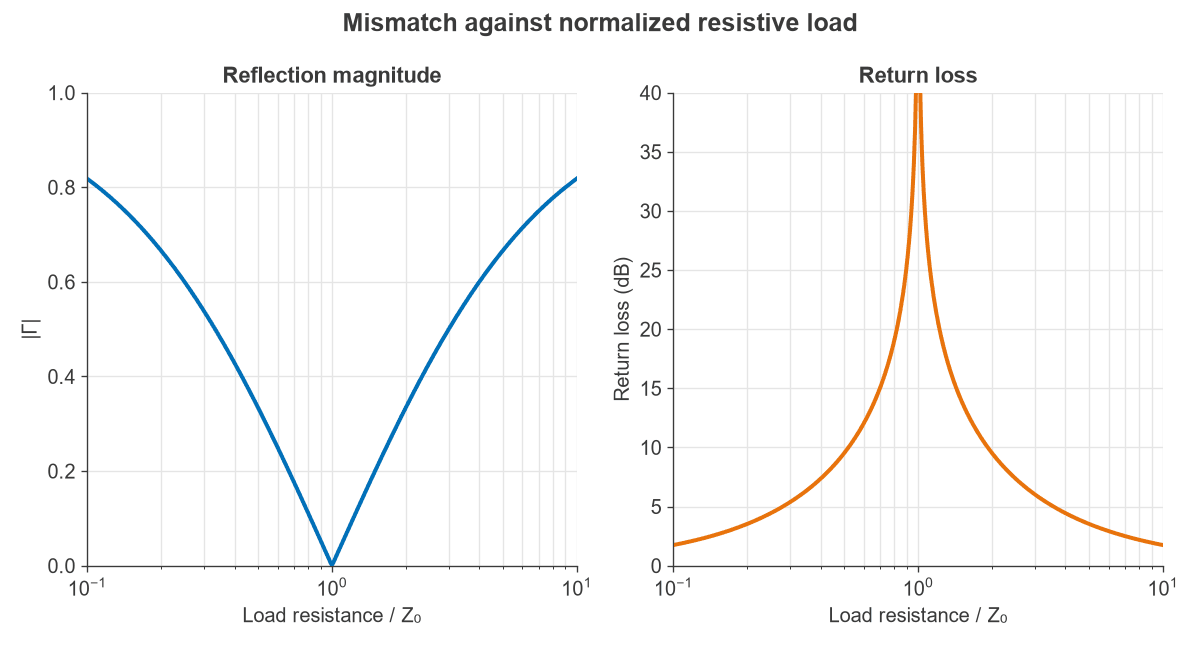
The current reflection coefficient has the opposite sign. This is why a short circuit doubles the current while cancelling the voltage. Figure 1 shows |Γ| and return loss against load resistance. The curves are symmetric on a log axis, so a load of 2Z0 reflects as strongly as one of Z0/2, with opposite sign.
The transmission coefficient
Voltage is continuous at a boundary, so the voltage just past the boundary equals the sum of incident and reflected waves. This gives:
τ = 1 + Γ = 2ZL / (ZL + Z0)
A value of τ above 1 surprises many readers, but it breaks no law. The voltage can rise when a wave enters a higher impedance, because the current falls by more, and the power transmitted remains below the incident power.
Voltage coefficients and power
Power goes with the square of voltage, and it depends on the impedance of the line carrying it. For a lossless line:
- Reflected power fraction: |Γ|2
- Delivered power fraction: 1 − |Γ|2
- Transmitted power into a line of impedance Z2 from a line of impedance Z1: |τ|2 × Z1/Z2 for real impedances
Measured quantities come directly from Γ:
- Return loss: RL = −20 log10|Γ| dB
- Mismatch loss: ML = −10 log10(1 − |Γ|2) dB
- VSWR: (1 + |Γ|)/(1 − |Γ|)
The VSWR, return loss and mismatch loss page has a calculator for moving between these figures.
Worked example: a complex load
A load of ZL = 30 − j40 Ω sits at the end of a 50 Ω line, with 10 W of forward power.
- Γ = (−20 − j40) / (80 − j40) = −j0.5, so |Γ| = 0.5 at an angle of −90°.
- τ = 1 + Γ = 1 − j0.5, so |τ| = 1.118 at −26.6°. The form 2ZL/(ZL + Z0) gives the same result.
- Return loss = 6.02 dB.
- VSWR = 1.5/0.5 = 3.0.
- Reflected power = 25 percent, or 2.5 W.
- Delivered power = 75 percent, or 7.5 W, a mismatch loss of 1.25 dB.
Note that |τ| is above 1 although only 75 percent of the power is delivered. Here the voltage across the load is 1.118 times the incident wave, but the load current and voltage are out of phase and the load is not 50 Ω.
Moving the reference plane along the line
Γ depends on where it is measured. Moving a distance d toward the generator on a lossless line keeps the magnitude and rotates the phase:
Γ(d) = ΓL e−j2βd
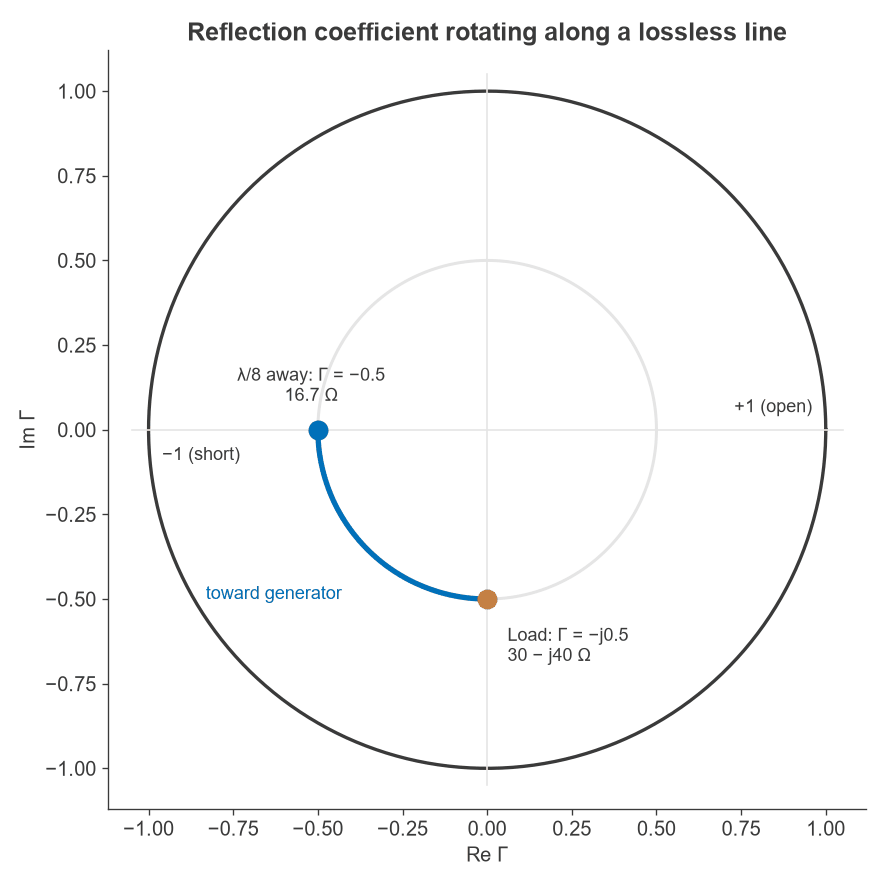
The factor of two arises because the wave travels the distance twice. On a lossy line, |Γ| also falls by e−2αd, which is why a long lossy cable can make a poor load look like a good one, as discussed under losses and power handling. Using the load from the example, a line one eighth of a wavelength long rotates Γ by −90°, as Figure 2 shows:
- Γ(λ/8) = −0.5, which is real and negative.
- Zin = Z0(1 + Γ)/(1 − Γ) = 50 × 0.5/1.5 = 16.7 Ω.
The line has turned a capacitive load into a pure low resistance, and the input impedance formula gives the same answer. This is the mechanism behind every stub and line-based match, and it is the reason for the Smith chart, which is a plot of the Γ plane with impedance contours drawn on it.
Junctions between two lines
The same formulas describe a junction between lines, with the second line acting as a load of Z2 if it is matched at its far end.
Worked example: a 50 Ω to 75 Ω junction
Suppose a 50 Ω cable connects to a 75 Ω cable that is properly terminated.
- Γ = (75 − 50)/(75 + 50) = 0.2.
- τ = 1 + Γ = 1.2.
- Reflected power = 0.22 = 4 percent.
- Transmitted power = 1.22 × 50/75 = 96 percent, which matches 1 − 0.04.
- Return loss = 14.0 dB, and insertion loss = 0.18 dB.
Viewed from the 75 Ω side, the signs change: Γ = −0.2 and τ = 0.8, with the same 96 percent of power crossing. The junction is reciprocal in power, but not in voltage. This small loss explains why a 75 Ω cable often works on a 50 Ω port, while still risking ripple if several reflections are spaced along a line.
Link to S-parameters
The coefficients map directly to S-parameters. S11 is the reflection coefficient at port 1 with port 2 matched, and S21 is the wave transmitted from port 1 to port 2. S-parameters use power waves normalized to each port’s reference impedance, so S21 is not the same as τ when the two impedances differ. For the junction above, normalized to 50 Ω and 75 Ω, |S21| = √0.96 = 0.98 rather than 1.2. Power then follows from |S21|2 without a further impedance correction.
Frequently asked questions
Can the reflection coefficient be greater than 1?
Not for a passive load, where |Γ| is at most 1. A value above 1 means more power returns than arrives, which implies gain. This can occur at the input of an unstable amplifier or a negative-resistance device, and the Smith chart then extends beyond its unit circle.
Why can the transmission coefficient exceed 1?
τ is a voltage ratio, not a power ratio. When a wave enters a higher impedance, its voltage rises while its current falls, so power is conserved. The 50 Ω to 75 Ω junction above shows τ = 1.2 with 96 percent of the power transmitted.
What is the difference between return loss and the reflection coefficient?
They give the same information in different forms. Return loss expresses |Γ| as a positive number of decibels, so a bigger number means a better match, and it drops the phase. A vector network analyzer reports the complex Γ, as S11.
Does a good reflection coefficient mean a good load?
It means that little power returns, not that the power is used well. A 50 Ω resistor and a highly efficient antenna can both show 30 dB of return loss. Loss in the line before the measurement point also improves the apparent figure.
Related topics
For load cases and stubs, see transmission line terminations. The time-domain effects of reflection are described in wave propagation in transmission lines, and matching networks can be sized with the impedance matching calculator.