INTRODUCTION
Contents
- 1 INTRODUCTION
- 2 RESULTS
- 2.1 SID integrated wirelessly with wearable devices
- 2.2 Wireless voltage induction to the drug delivery device by the wearable power transmitter
- 2.3 Release of loaded drugs from the drug delivery device by the wireless power transmission
- 2.4 Mechanical reliability and biological safety of the SID
- 2.5 Demonstration of seizure suppression using animal models in vivo
- 2.6 Drug release demonstration based on human EEG signals and a large-size SID ex vivo
- 3 MATERIALS AND METHODS
- 3.1 Fabrication of the front side of the SID
- 3.2 Fabrication of the drug reservoir
- 3.3 Simulation of the wireless power transfer efficiency
- 3.4 Fabrication of the backside of the SID
- 3.5 Immumnohistochemistry
- 3.6 Analysis of the eluted metal ion concentration
- 3.7 1H NMR spectroscopy analysis of diazepam before and after electrolysis
- 3.8 Analysis of the EEG signals and the survival rate of the SE mouse model
- 3.9 Quantification of the BBB permeability
- 3.10 Drug release demonstration from a large-size SID using human EEG data ex vivo
- 3.11 Ethical approval
Implantable (1–4) and wearable (5–7) biomedical devices have been highlighted as essential components for personalized health care systems (8). Therapeutic devices integrated with biosensors that continuously monitor key health signals have enabled in situ diagnosis and therapy (9). For example, a controlled transdermal drug delivery device integrated with biosensors that continuously monitor key health signals was proposed (10). The implantable defibrillator has provided programmed electrical stimulations based on abnormal electrocardiogram detection (11, 12). Implantable microchips for electrical stimulation therapy with wireless powering were also reported (13, 14). Implantable drug delivery devices, such as artificial pancreas, have customized the drug delivery dosage based on the blood glucose analysis (15, 16). An implantable device to release hormones periodically has been demonstrated via human trials (17). Fully implantable optofluidic systems for wireless optogenetics and pharmacology were also reported (18–21).
Although various in situ treatment and biosensing strategies via either implantable or wearable devices have been developed, critical challenges still remain. Transdermal drug delivery patches exhibit slow drug delivery rate and limited drug choices because of the skin barrier (22). Therefore, they are oftentimes inappropriate for situations in which immediate treatment is required. Meanwhile, implantable devices can administer rapid treatment with excellent therapeutic efficacy (23, 24). However, conventional implantable devices require surgery accompanying large incision for implantation of bulky devices as well as periodic replacement of batteries. Moreover, they involve serious mechanical mismatch with surrounding tissues mostly because of rigid power supply modules, sensors, and control electronics, which oftentimes induces side effects such as collection of scar cells (25). Therefore, a novel bio-integrated system that takes advantage of both implantable and wearable devices is in need. Such a system can be particularly useful for point-of-care and sensor-assisted monitoring and treatment of urgent medical situations.
In medical emergencies, including fatal seizures, elapsed time after occurrence of the symptom is a key factor that determines prognosis and survival of patients (26), and thus, prompt treatment based on the on-site diagnosis is extremely important. For example, status epilepticus (SE) is a fatal medical condition in which a single epileptic seizure lasts longer than 5 min or multiple seizures outbreak without returning to the normal state (27, 28). About 1% of all visits to the emergency department are caused by SE (29), and the incidence rate of convulsive SE is 7 per 100,000 people (30). When SE occurs, benzodiazepines, such as diazepam, lorazepam, or midazolam, should be immediately administered via possible routes, such as intravenous, intramuscular, subcutaneous, or rectal pathways, to stop the seizure (31). Without prompt pharmaceutical treatment using benzodiazepines, SE can lead the patient to death through brain damages and/or systemic complications, such as rhabdomyolysis or renal failure (32). However, it is oftentimes difficult for patients under these fatal seizures to be immediately found by caregivers. Although discovered, it takes time to transfer them to the hospital via ambulances for the full-fledged medical treatment.
Ideally, a soft and implantable drug delivery device (SID) that provides rapid pharmaceutical treatment can be applied to a patient who has high-risk factors for SE. The risk factors for SE include previous history of SE [1 year recurrence rate, 11%; (30)] and drug resistant epilepsy syndromes such as the Lennox-Gastaut syndrome [0.26 in 1000 children (33)] and the Dravet syndrome [1 per 15,700 children (34)]. Patients with these high-risk factors can put on wearable devices for continuous biosensing and transcutaneous power supply to SID. The SID and wearable devices should be wirelessly integrated to each other. See fig. S1 for the monitoring and treatment scenario. During normal life, a wearable device monitors electroencephalography (EEG) signals without disturbing daily activities. If a fatal epileptic medical emergency such as SE occurs, then the wearable sensor detects this condition and wirelessly sends a command signal to the wearable power transmitter for wireless power supply to the SID and immediate release of loaded drugs. Near-field coil pairs can be used for transceiver pairs to operate the SID with minimum tissue heating (35) (more details are included in text S1). The prompt subcutaneous drug release suppresses seizure, and an alarm signal is sent to the nearest caregivers through the wireless network. Because administration of drugs such as benzodiazepine is a first-line treatment, the patient must visit a hospital for further medical treatments. Nevertheless, according to the degree of risk for SE, the SID has potential to prevent death of patients in case that immediate treatment is not available from nearby witnesses. Despite these exceptional benefits, such a bio-integrated system for point-of-care treatment of fatal seizures has not been developed yet.
RESULTS
SID integrated wirelessly with wearable devices
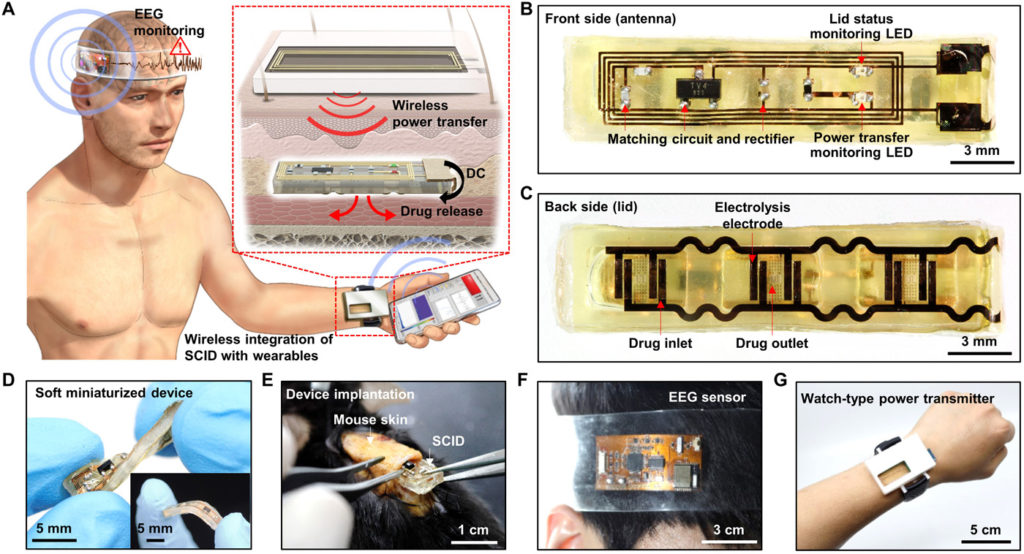
We here present a novel bio-integrated system for rapid in situ treatment of fatal epileptic medical emergencies based on continuous EEG monitoring. The proposed system consists of SID, a wearable electrophysiology sensor, and a wearable power transmitter (Fig. 1A). The SID is implanted in the subcutaneous region nearby the wrist, and then the watch-type power transmitter is worn above the SID. The electrophysiology sensor is attached on the subject’s head to monitor EEG signals. A commercial portable device can be used for data processing and wireless control of the system. The location of the SID and the power transmitter can be moved from the wrist to the upper arm or chest (fig. S2A), in which other types of wearable power transmitters such as the armband-type or patch-type device can be used instead of the watch-type device based on the patient’s preferences or situation (fig. S2, B and C). In the case of the watch-type transmitter, convenience in terms of wearing and monitoring can be a benefit, while other types (i.e., armband or patch) can minimize movement of the device. The SID, wearable sensor, and wearable power transmitter are wirelessly interconnected to each other.

(A) Schematic illustration of an SID in the subcutaneous region, which is wirelessly integrated with a wearable power transmitter and a wearable EEG monitoring device. Inset shows the wireless power transfer through the skin, which induces the subcutaneous drug release from the SID. (B) Image of the front side of the SID. LED, light-emitting diode. (C) Image of the backside of the SID. (D) Soft mechanical characteristics of the SID allows it to be freely twisted and bent (inset). (E) The SID can be implanted in the subcutaneous region of the mouse’s back with a minimal surgical incision. (F) Image of a wearable EEG monitoring device. (G) Image of a wearable power transmitter for the wireless power supply to the SID. Photo credit: Hyunwoo Joo, Seoul National University.
Figure S3A shows a flowchart for the system operation. Because SID is placed under the skin, position alignment for wireless coupling between the wearable power transmitter and SID can be assisted by the light-emitting diode (LED)–based coupling indicator on the SID (fig. S3A, i). The wearable sensor monitors EEG, and the data are wirelessly sent to a portable device for data processing. When seizure is detected, the system measures the elapsed time from the seizure onset. If the seizure halts within 5 min, then the system returns to its monitoring state. However, if the seizure continues for more than 5 min, then the system diagnoses the condition as SE and wirelessly sends a command signal that turns on the wearable power transmitter. Then, the wearable power transmitter generates a strong radio frequency (RF) signal for the wireless power transmission to the SID. The SID receives the RF power and immediately releases the loaded drug (fig. S3A, ii). Figure S3 (B to D) shows block diagrams of the electronic circuit construction for the system. Figures S4 and S5 show detailed circuit designs of the wearable sensor and power transmitter, respectively (more details are included in text S2).
The key device of the system is the SID (Fig. 1, B and C, front and backside). It has a dimension of 5 × 25 × 2 mm (width × length × height), where ~50% of the device volume corresponds to cavities for loading drugs (~120 μl). The body of the SID is made of silicone rubber (Ecoflex, Smooth-on, USA; Young’s modulus, 68.9 kPa) for its deformable mechanical property (Fig. 1D). The SID consists of the wireless power receiving and drug delivery unit. This structural simplicity, i.e., device construction without batteries, sensors, and control electronics, allows to achieve the softness and miniaturization of the SID. With minimal surgical incision (less than 1 cm; Fig. 1E), the SID can be implanted into the subcutaneous region. Thus, rapid pharmaceutical treatment bypassing the skin barrier can be applied, while invasiveness for implantation of the SID is minimized. The wireless integration of the SID with wearable devices (EEG sensor and power transmitter; Fig. 1, F and G) has enabled bulky and rigid device components including sensors, batteries, and data processing circuits to be moved from the SID to wearable devices.
Wireless voltage induction to the drug delivery device by the wearable power transmitter
One of the key technologies to operate the entire system is the controlled wireless power transmission from the wearable power transmitter to the SID. The transmitted RF signal is received by the flexible antenna located on the front side of SID (Fig. 1B) and converted into the DC voltage output by the impedance matching circuit and rectifier, while two LED indicators on the device display the condition of the device coupling and drug release. Detailed fabrication procedures of the front side of SID are described in fig. S6 and Materials and Methods.
The wireless power transmission units are designed to induce maximum voltage across the receiver coil with minimum tissue heating. The receiver antenna is a coil with a dimension of 20 × 4 mm, which is decided in consideration of the size of the SID. Because the induced voltage at the receiver coil is proportional to the change rate of the magnetic flux going through the coil area (S), it is equivalent to find the current distribution at the transmitter that maximizes the efficiency (η), defined as a ratio of the coupling between transceivers to the power loss, as follows(i)where ω is the radian frequency of the induced magnetic flux density B, and ϵ” is the imaginary part of the tissue’s dielectric permittivity. The numerator represents the magnetic coupling with the receiver coil of area (S), while the denominator accounts for the power loss inside the tissue due to the oscillating electric field E from the transmitter. To maximize the efficiency, the transmitter is designed as a coil structure, whose size is similar to the receiver coil size (text S1 and fig. S7 for details).
Once the transmitter structure is decided as a coil, the operating frequency is decided by considering the overall power loss in the human tissue environment. A numerical simulation of the wireless coupling is performed using a commercial electromagnetic (EM) simulator (Ansys HFSS, Ansys Inc., USA). In the EM simulation, the efficiency incorporates the conduction loss of the coil as well as the tissue heating (see Materials and Methods for simulation details). The highest efficiency is obtained between 30 and 60 MHz (Fig. 2A). The operating frequency is determined as 40 MHz to avoid the spectrum overlap with the shortwave radio band (3 to 30 MHz) and very high frequency (VHF) TV band (54 to 88 MHz) of the United States. The matching network is included in the transmitter coil (fig. S8), to minimize the power reflection (S11) at 40 MHz, as shown in Fig. 2B. The simulation results show that the resonant frequency of the transmitter is not affected much by the tissue model (fig. S9), demonstrating the robustness of the power link against the uncertainty of the tissue. This is because the operating frequency is much lower than the self-resonant frequency (250 MHz) of the transmitter coil.

(A) Simulation result of the efficiency versus frequency. (B) S11 measurement and simulation results of the transmitter coil. (C) Output voltage measurement and simulation results under different RF signal strengths with the lid resistance of 5 kilohms. (D) Simulated 1-g average specific absorption rate (SAR) when the 19-dBm RF signal was transmitted from the transmitter coil. (E) Schematic illustrations for brightness changes of LED indicators during device coupling and drug release. (F) Images for brightness changes of LED indicators during device coupling and drug release. (G) Simulation of normalized efficiency changes under displacements in the x, y, and z axes. (H) Output voltage measurement under displacements in the x, y, and z axes. (I) Simulation of normalized efficiency changes by tissue component variation. (J) Simulation of normalized output voltage affected by displacements (∣Δy∣≤ 1.5 mm, ∣Δz∣≤ 1 mm) and tissue composition changes (2 mm ≤fat thickness ≤10 mm) under various input powers. Photo credit: Hyunwoo Joo, Seoul National University.
The transmitter generates the RF power in two different levels, one for initial alignment of devices and the other for drug release. In the wireless coupling mode, the RF signal below 10 dBm is transmitted, and the SID receives voltage less than 2 V when the lid resistance [i.e., electrical resistance of the layer that contains electrolysis pads and fuse (cf., this layer is called as a lid), which is dominantly contributed by electrical resistance of the fuse] is 5 kilohms (Fig. 2C). The simulation also confirms that the measurement is within a reasonable range. This low voltage does not trigger the drug release but can turn on LEDs to indicate the system condition. Both red and green LEDs are used to indicate the degree of alignment between the wearable RF transmitter and the receiver on SID (Fig. 2, E and F, left and middle frames). Because LEDs become brighter as the alignment improves, the transmitter and the SID can be aligned upon the maximum brightness of both LEDs.
When emergency biosignals are detected, however, the RF signal as high as 19 dBm is supplied to generate the high voltage (~7 V) to release the drug immediately (Fig. 2C). Particularly, the green LED indicates the fuse status, which represents the drug delivery status. If the fuse remains intact, then the circuit including the fuse and green LED forms a closed loop to turn the green LED on. In the drug release mode, the lid including the fuse is ruptured for the drugs loaded in the reservoir to be released, and thereby, the loop is disconnected. This disconnection turns the green LED off, while the red LED is still on to confirm the stable wireless coupling (Fig. 2, E and F, right frame).
Figure 2D shows the simulation result of the specific absorption rate (SAR) of the tissue under the maximum RF power of 19 dBm. The maximum 1-g average SAR is ~1 W/kg with the skin tissue. This result is significantly lower than the U.S. Food and Drug Administration regulation of the whole-body SAR for magnetic resonance imaging (4 W/kg per 15 min) (36). It is far below the exposure threshold of the safety guideline (37). Moreover, the Federal Communications Commission limit for public exposure to electromagnetic field from cell phones is 1.6 W/kg. This implies that the RF signal used in our system is compliant with safety standards.
To ensure reliable wireless coupling, the output voltage of the SID under various lid resistances is examined. The output voltage depends on the resistance of the lid, which is controlled by adjusting the thickness of the fuse (fig. S10), because it affects the impedance of the device. When the resistance is as low as 1 kilohm, the maximum output voltage is ~4 V. When the resistance is increased to 2, 5, and 10 kilohms, the maximum output voltage becomes ~6, ~7, and ~7 V, respectively (Fig. 2C and fig. S11). Throughout the remaining experiments, the resistance of the lid was fixed as ~5 kilohms (i.e., ~35-nm fuse thickness), under which the largest and most stable maximum output voltage is obtained.
Figure 2 (G and H) shows reliability of the wireless coupling under misalignment of SID from the transmitter. The small displacement does not critically affect the wireless coupling. Under device displacement along the x axis, the wireless coupling is stable up to 4-mm displacement, and along the y axis, it remains above 80% up to 2-mm displacement (Fig. 2G). Experiments confirm that the output voltage change under displacement shows a similar tendency with the simulation (Fig. 2H). On the basis of the data, the drug release process of the SID would be possible even under >6 mm of x axis displacement and ~3 mm of y and z axes displacement. Armband-type or patch-type devices are useful for better fixation of the alignment (fig. S2).
Figure 2I shows how variation of the tissue composition affects the wireless coupling. The efficiency change was studied with various fat thicknesses between 0 and 15 mm, while the total thickness of the fat and muscle in the multilayered tissue model was fixed as 15 mm. The efficiency does not change notably depending on the tissue composition.
Figure 2J shows the normalized output voltage versus the input power under various conditions studied in Fig. 2 (G to I). Obviously, the output voltage changes depending on the input power level as well as the external conditions such as displacement (Fig. 2, G and H) and tissue composition (Fig. 2I). When the input power of 10 dBm (wireless coupling mode; green dotted box) and 19 dBm (drug release mode; blue dotted box) are applied to the SID (Fig. 2J), output voltages show large differences without overlap despite the efficiency variations under various external conditions. This wide safe zone (gray area in Fig. 2J) assures that output voltages under different modes do not overlap, and therefore, accidental drug triggering by unwanted high-voltage induction could be prevented.
Release of loaded drugs from the drug delivery device by the wireless power transmission
Figure 3A presents an exploded view showing the backside design of the SID including the drug reservoir and lid (Fig. 1C). The drug reservoir is fabricated with silicone rubber whose modulus is 68.9 kPa for the SID to be mechanically comparable to surrounding tissues. Multiple thin film encapsulations of parylene (~1 μm) and epoxy (bottom layer, ~700 nm; top layer, ~10 μm) are used to block the drug leakage and water penetration between the reservoir and surrounding tissues. The Pt pads are used as electrolysis electrodes for water decomposition (Fig. 3B). Figure 3C shows the shape of the drug inlet and outlet. The drug is injected into the reservoir through the inlet hole via an ultrathin syringe needle, followed by encapsulation of the inlet. Detailed device fabrication of the backside of the SID and the drug loading procedure are described in fig. S12 and Materials and Methods.

(A) Exploded schematic illustration of the backside of the SID to show its design. (B) Image of the lid and reservoir of the SID. (C) Magnified view with an optical camera image of the drug inlet and outlet of the SID. (D) Schematic illustration of the drug release process using the water electrolysis. (E) Time-lapse optical camera images of the drug release process. (F) Images of the fuse before (left) and after (right) the drug release. (G) Drug release profile from the SID in vitro. (H) Images of the drug release on porcine tissues ex vivo (left, before drug release; middle, during wireless power supply to the SID; right, after drug release). Evans blue was used as a model drug for easy visualization of the released drug. Photo credit: Hyunwoo Joo, Seoul National University.
The voltage difference between the anode and cathode rapidly electrolyzes water in the drug solution into oxygen and hydrogen vapor, which creates bubbles inside the drug reservoir. The internal pressure increases, induced by the generated bubbles. This increased pressure ruptures the fuse and pushes the loaded drug outward (Fig. 3D). Time-lapse images of the drug release (Fig. 3E) show that the gas bubbles are vigorously generated as soon as the voltage (7 V) is wirelessly induced (within 0.5 s). As the internal pressure reaches the critical rupture pressure, the outlet including the fuse is destroyed (~1 s), and the loaded drug is ejected from the reservoir rapidly (~10 s). See movie S1 for the drug release process. The power consumption of the transmitter in active state (i.e., when RF transmission is on) is ~0.7 W. By a simple calculation, the battery can transfer power wirelessly for ~2 hours, which is much longer than the required time for the drug release. The intact and ruptured fuse, before and after the drug release, are shown in Fig. 3F (left and right, respectively). After the rupture of the lid, the resistance of the closed circuit including the fuse increases ~500 times, which turns off the green LED as an indication of the successful drug release.
The time duration to release the drug from the SID is measured in vitro. When the voltage (7 V) is applied, ~80% of the loaded drugs are ejected within 70 s (Fig. 3G). The wireless drug release from the SID is also tested on porcine tissues ex vivo. Power was wirelessly supplied for 30 s, and the model drug was released from the SID and rapidly absorbed by nearby tissues (Fig. 3H). In this ex vivo demonstration, Evans blue was used as model drug for easy visualization of the drug release.
Mechanical reliability and biological safety of the SID
Strain can be induced in the SID when it is deformed by body motion or pressed through the skin. The fuse on the lid of the drug reservoir should be intact under the induced strain. Both experimental and numerical studies have been carried out to investigate mechanical stability of the SID. Figure 4 (A and B) plots the measured resistance change in the fuse when the SID was subjected to bending or pressing, respectively. The lid resistance of the SID remains unchanged, which implies that the drug reservoir including the lid is intact without mechanical failures, until the bending radius reaches ~2 mm (Fig. 4A and fig. S13A) or when the skin is subjected to a vertical pressure up to ~20 kPa (Fig. 4B and fig. S14). Because the reservoir made of silicone rubber has a considerably greater thickness and a smaller modulus than the lid, most of the strain from the bending deformation is absorbed by the reservoir (38, 39). Moreover, the SID endured the repeated bending test (bending radius of 4 mm for 100 times), in which no resistance change of the lid was observed (fig. S13B).

(A) Resistance change of the lid during the bending deformation of the SID. (B) Resistance change of the lid under application of the various vertical pressures. (C) Induced strain at the fuse as a function of bending radius, estimated through FEA. (D) Induced strain at the fuse as a function of the vertical pressure applied on the skin, estimated through FEA. Each thickness represents the skin thickness of the front of arm (red), scalp (blue), and back (green) (48, 49). (E) Image of the mouse skin under which the SID is implanted. (F) Image of indicator LEDs on the SID. LED lights are shown through the skin. (G) Image of the mouse muscle tissue on which the SID is implanted. No sign of the drug leakage was observed. (H) Image of the implanted SID after its extraction from the animal. (I) Immunohistology analysis results [hematoxylin and eosin (H&E), CD3, CD20, CD68] for the tissues that encase the implanted device after 4 weeks of the device implantation. Photo credit: Hyunwoo Joo, Seoul National University.
To investigate the mechanical reliability of the SID further, finite element analysis (FEA) for the strain distribution of the deformed SID was carried out by using a commercial software (ABAQUS, Dassault Systèmes SE, France) (text S3 for details). Figure 4 (C and D) and fig. S15 show the strain distribution across the SID under bending and pressing. Because the SU-8 layer is substantially thicker than the Au fuse layer, the critical fracture strain is determined by SU-8 (1.6%) (40). When the SID is bent, the induced strain does not reach the critical level to induce mechanical fracture until the bending radius of 1.89 mm (Fig. 4C and fig. S15A). Figure 4D and fig. S15B show that the strain applied to the fuse would reach 1.6% when a vertical pressure of 23 kPa is applied to the SID covered with 1-mm-thick skin. As the skin thickness increases, the SID will experience less strain because the thicker skin absorbs more energy and dissipates the applied strain. Therefore, both simulation results ensure the mechanical reliability of SID under bent and pressed situations.
Figure 4 (E to H) shows the mechanical stability of the SID, which is confirmed via animal experiments in vivo. The device containing model drug (Evans blue; for visualization) was implanted to the subcutaneous region near the back of a mouse. The mouse freely moved around the cage for 4 weeks, and the dynamic motions of the mouse had induced multiple bending and pressing deformations to the implanted device. After 4 weeks, the surgical incision was healed well, and no sign of skin irritation or inflammation was observed (Fig. 4E). The LED indicators showed that the circuit in the SID was intact (Fig. 4F). The implanted SID was extracted by surgery, and no sign of tissue staining by the drug leakage was observed (Fig. 4G). The extracted device also showed no mechanical damage or drug leakage (Fig. 4H). The leakage and water penetration of the SID were tested further. An SID filled with a model drug solution (rhodamine B added to a saline solution with a concentration of 0.1 mg/ml) was submerged to 20 ml of pure saline solution and was kept at 65°C for 1 week for an accelerated test. After 1 week, the concentration of the model drug in the SID was calculated by measuring the absorbance with a microplate reader. The result shows that the concentration of the dye was not considerably changed from the initial state (model drug solution, ~95% of initial concentration; exterior saline, <0.001% of initial concentration of model drug solution), implying that a negligible amount of water penetration occurred. Considering that the test condition was much harsher than the condition in vivo because of extreme water content and high temperature, we could find out that the encapsulation of the SID against leakage was reliable.
The biological safety of the SID was tested through the histology analysis in vivo. The inflammation factors near the implantation site were analyzed. The devices were subcutaneously implanted in 12 mice for 4 weeks. Immunohistology analyses [hematoxylin and eosin (H&E), CD3, CD20, and CD68] of the tissue that directly encases the implanted device present neither tissue necrosis nor infiltration of inflammatory cells (Fig. 4I), which confirms the biological safety of the SID. Although the device is fully encapsulated after the chips are soldered on the antenna, the amount of the potentially eluted metal ions from the antenna in the aqueous environment was measured to confirm the biological safety of the SID. The SID was put in 80°C deionized water for the accelerated test. The results from the inductively coupled plasma atomic emission spectrometer (ICPS) show that the amounts of Sn, Bi, Ag (main components of the solder), and Cu (main component of the antenna coil) showed negligible differences from the control (deionized water) (fig. S16). As a result, the material safety of SID could be confirmed.
The integrity of the drug during its release process was also analyzed by nuclear magnetic resonance (NMR). The drug without any treatment and the drug that was applied 8 V for 1 min were examined by using NMR. The results show that the drug before the treatment and that after the treatment did not show any significant difference, indicating that the electrolysis process did not cause any notable change in the drug (fig. S17). Moreover, based on the I–V curve measured while applying voltage to the drug solution, the total amount of the electrical charge that passed between two Pt electrodes was 1.95 × 10⁻¹ C. Assuming all electrical charges were used for electrolysis of water, ~0.02 ml of H2 and ~0.01 ml of O2 are expected to be generated at 1 atm/0°C. Because the volume is small, the influence of the generated gas is expected to be negligible. In the case of the animal experiments, we could not observe any abnormal effects by the generated bubbles.
Demonstration of seizure suppression using animal models in vivo
The detection of SE and its suppression with the wirelessly integrated system (i.e., EEG sensor, power transmitter, and SID) were demonstrated in vivo by using an animal model of SE. SE was induced in the mouse model using pilocarpine (41, 42). Figure S18 (A and B) shows a schematic illustration and corresponding images of the setup for the animal experiment. Because the EEG signals could not be measured from the scalp of the mouse due to its small size and weak EEG signals, a separate recording electrode was used to contact the dura, and the electrode was connected to the channel of our wearable EEG sensor. The EEG signals collected from the wearable EEG sensor were wirelessly transferred to a portable device (e.g., tablet computer) via Bluetooth for data processing and visualization. The EEG signal was simultaneously measured by the commercial equipment for comparison. The SID was subcutaneously implanted at the back of the subject mouse.
The EEG data collected from the commercial equipment (fig. S18C) and our EEG sensor (fig. S18D) are comparable. A custom-made software code detects the seizure and measures the elapsed time from the onset of the continuous seizure, which is required for the diagnosis of SE. When SE is detected, the portable device wirelessly sends a command signal to the power transmitter to wirelessly transmit a strong RF signal to the SID for the drug release. More detailed explanation of the software and its algorithm for the system operation are described in figs. S19 and S20 and text S4.
By using this animal experiment setup, wireless transmission of the command signal to the power transmitter and wireless power transfer to the SID for the subcutaneous drug release were tested in vivo. Figure 5 (A to D) shows the measured EEG data of the control and experimental groups. In both groups, pilocarpine was injected into the subject mice to induce the seizure and SE. The control group did not receive any treatment, while the experimental group was treated with diazepam via subcutaneous drug release from the SID. When the induced seizure persisted for longer than 5 min and thus the condition of the subject mouse was diagnosed as SE by the algorithm, the drug in the SID was released by the wireless power transfer.

(A) Spectrogram of the EEG signals under the seizure obtained from the control (no treatment) group. (B) EEG signals from the control group at different time points. (C) Spectrogram of the EEG signals under the seizure obtained from the experimental (subcutaneous drug release) group. (D) EEG signals from the experimental group at different time points. (E) Survival rate of the experimental (red) and control (blue) groups. ***P < 0.001 by the log-rank test. (F) Experimental procedure to check the integrity of the blood-brain barrier (BBB) under SE. IV, intravenous. (G) Images of the brain (left) and its dissected samples (right) for the experimental (top) and control (bottom) groups. Evans blue was intravenously injected to check the integrity of the BBB. (H) Amount of Evans blue in the resected mouse brain for the experimental and control groups. **P < 0.01 by the Mann-Whitney U test. Box, standard error; line, median; whisker, minimum-maximum. Photo credit: Hyunwoo Joo, Seoul National University.
Figure 5A shows the spectrogram of the EEG signal from a mouse in the control group. For this typical mouse, the continuous seizure started 20 min after the pilocarpine injection, and turned into SE in 5 min (i.e., 25 min after the pilocarpine injection), which led to death of the subject mouse in 10 min (i.e., 35 min after the pilocarpine injection). Figure 5B shows that the EEG signal diminishes after 10 min of the SE onset (i.e., 35 min after the pilocarpine injection).
Figure 5C shows the spectrogram of the EEG signal from a mouse in the experimental group. For this typical mouse, the continuous seizure started 15 min after the pilocarpine injection and turned into SE in 5 min (i.e., 20 min after the pilocarpine injection). The seizure could be suppressed by the released drug from the SID (Fig. 5C), and thus, the subject mouse survived over 24 hours. The EEG signals also show that the amplitude and the frequency of the seizure peaks have decreased due to the diazepam release from the SID (Fig. 5D). See movie S2 for the overall system operation including the seizure detection, the SE diagnosis, and the subcutaneous drug release for the suppression of SE.
As a result of the rapid in situ pharmaceutical treatment, the SID could significantly improve the survival rate of the subject mice with SE (Fig. 5E). In the control group (n = 6), more than 80% of mice died within 1 hour after the pilocarpine injection due to SE. However, every mouse in the experimental group (n = 6) could survive through the SE because of the prompt in situ pharmaceutical treatment by the SID.
To confirm the importance of the prompt pharmaceutical intervention in case of SE, the integrity of the blood-brain barrier (BBB) after SE (i.e., degree of damages to the BBB under SE) was analyzed. Two animal groups, an experimental group (SID treatment group, to which the immediate subcutaneous drug administration after the onset of SE was applied by SID) and a control group [standard treatment group, to which intraperitoneal drug injection after 40 min from the onset of SE was applied (43)], were compared (Fig. 5F). Three days after the SE onset, Evans blue was intravenously administrated to both groups through the tail vein to estimate the BBB integrity. Figure 5G shows images of the brain (left) and its axially dissected samples (right). Brain samples from the experimental group show no sign of BBB leakage (top), while extravasation of Evans blue is observed in the control group (bottom). Quantification of the Evans blue permeation shows that there was significantly less BBB leakage in the experimental group than in the control group (Fig. 5H). These results indicate that the prompt pharmaceutical treatment by the SID in case of SE reduces the brain damage caused by the seizure and increases the survival rate.
Drug release demonstration based on human EEG signals and a large-size SID ex vivo
To demonstrate the potential for the human application of the developed system, the drug release was tested by using the EEG signals from a patient who underwent continuous EEG monitoring during SE. To use the system for humans, a larger dosage of the drug than that used for the mouse model should be applied. Therefore, we herein demonstrated the drug release from a large-size device that can contain a large amount of the drug.
A large-size SID was designed to contain 1 ml of the drug, which corresponds to the clinical standard of the first-line treatment for patients with SE (31). Figure 6A shows a modified design of the scaled-up SID. Other details, such as the system operation algorithm, material compositions, device designs, wireless power transfer principle, and drug release mechanism, remain the same, while only the device dimension is scaled up to 8.5 × 60 × 4 mm (width × length × height).

(A) Image of the backside of a large-size SID that is scaled-up to be compatible with the amount of drug required for the human application. (B) Experimental setup for the drug release demonstration from the large-size SID with human EEG signals ex vivo. (C) Spectrogram of the prerecorded EEG signals from a patient with SE. (D) Human EEG signals at different time points. (E) Image of the SID before the release of the model drug between the porcine skin and the muscle tissue. (F) Image of the SID after the release of the model drug. Evans blue was used as a model drug for easy visualization of the drug release. Photo credit: Hyunwoo Joo, Seoul National University.
Figure 6B shows an experimental setup for the drug release demonstration by using the large-size device in consideration of the human application. The prerecorded human EEG signal was applied to the sensor unit. When SE was detected (i.e., 5 min from the onset of the continuous seizure) by the system, a command signal was wirelessly delivered to the power transmitter to send a strong RF signal for the wireless power supply to the SID and to operate the large-size SID for the drug release. The drug release was demonstrated by using a model composed of the porcine skin and muscle tissue ex vivo.
Figure 6C shows a spectrogram of the human EEG signal collected with a skin-mounted electrode on the F3 position of the patient by using a commercial device against the average reference (i.e., F3-Av). The spectrogram shows that the continuous seizure started at ~10 min and continued until ~15 min. The EEG signal (Fig. 6D) also confirms that the amplitude and frequency increased significantly at 10 min, and the increase became more severe at 15 min. By using this prerecorded EEG signals from a human patient, we demonstrated the drug release from the large-size SID ex vivo.
The SID is placed between the porcine skin and the muscle tissue, while the RF transmitter is attached on the porcine skin. The applied human EEG signal was analyzed by the system, and SE was detected by the algorithm of the sensor unit. Then, the wearable RF transmitter was activated for the wireless power supply, which subsequently induced the drug release from the SID. Before the SE onset, the model drug (Evans blue) remained inside the SID, and no sign of leakage was observed (Fig. 6E). However, when SE was detected by the system, the transmitter supplied power to the SID wirelessly, which induced the release of a large amount of the model drug from the SID successfully (Fig. 6F).
MATERIALS AND METHODS
Fabrication of the front side of the SID
The microfabrication of the receiver antenna (fig. S6, i to vi) starts with spin coating of the polyimide [PI; poly(pyromellitic dianhydride-co-4,4′-oxydianiline), amic acid solution, Merck KGaA, Germany] solution on a silicon oxide wafer. Then, the first Cu layer is deposited for the receiver antenna coil and patterned by photolithography and wet etching. An epoxy layer (SU-8 10, MicroChem Corp., USA) is coated and patterned for via holes. The second Cu layer is deposited and patterned for chip pads. Another epoxy layer (SU-8 10) is coated and patterned for encapsulation and contact pad opening.
Antenna integration and chip soldering (fig. S6, vii to ix) start with pickup of the fabricated antenna with a polydimethylsiloxane (PDMS) stamp (SYLGARD 184, Dow Corning Corp., USA). The surfaces of the drug reservoir and antenna are modified gently by oxygen plasma for improving adhesion. A small amount of silicone rubber was applied to the surface of the reservoir as an adhesive to attach the antenna to the reservoir. After thermal curing in a 70°C oven over 1 hour, the PDMS stamp was gently detached with assistance of ethanol.
The exposed Cu pads were plated with tin by applying a tin plating solution [100 ml of deionized water, 0.5 g of tin(II) chloride, anhydrous (Alfa Aesar, USA), 2.0 g of thiourea (Alfa Aesar, USA), and 3.0 g of amidosulfonic acid (Alfa Aesar, USA)] for 30 to 60 s. After applying the solder paste (SID291SNL250T3, Chip Quik, USA) to tin-plated pads, chips were carefully placed on the pads, and heat was subsequently applied with a heat gun to solder the chips.
Fabrication of the drug reservoir
The drug reservoir was fabricated by using a two-step molding process. First, a master mold was fabricated with an acrylic plate via the milling process. The surface of the master mold was rinsed with ethanol and treated with oxygen plasma. Then, the mold was placed in an airtight container for gas phase deposition of trichloro(1H,1H,2H,2H-perfluorooctyl)silane (FOTS, Merck KGaA, Germany) for at least 1 hour with a small dish filled with 100 μl of FOTS mixed to 10 ml of n-Heptane (Samchun Pure Chemicals Co. Ltd., Republic of Korea).
To make a negative mold of the master mold, parts A and B of a silicone rubber (Ecoflex 00-30, Smooth-on, USA) were mixed as a 1:1 weight ratio and poured into the surface-treated master mold. After degassing the prepolymer mixture in a desiccator, it was thermally cured in a 70°C oven over 1 hour. The fully cured silicone rubber negative mold was detached from the master mold and underwent gas phase deposition of FOTS as previously described. Then, the silicone rubber (Ecoflex 00-30) mixture was applied to the negative mold and degassed in a desiccator. After thermal curing on a 70°C hot plate over 1 hour, the fully cured reservoir was detached from the negative mold. Then, the reservoir was encapsulated with parylene-C (diX-C, Kisco Ltd., Japan).
Simulation of the wireless power transfer efficiency
Physical structures of the transmitter and receiver coil are imported into the commercial EM simulator, including the tissue environment. The EM simulator models the link between coils as a two-port impedance matrix Z, where ports 1 and 2 are assigned as an input of the transmitter and receiver coil, respectively. The efficiency accounting for all the power losses in the system is approximated as η ≈ ∣∫S ωB · dS∣2/(∫tissue ωϵ ” ∣E∣2dr + ∫coil σ∣E∣2dr). When the transmitter coil is excited with the input current I1, the induced voltage at the open-circuited receiver coil is |Z21I1|, corresponding to the numerator of the efficiency. The denominator incorporating all the power loss can be modeled as R11|I1|2. Therefore, the efficiency can be obtained with |Z21|2/R11 from the EM simulation.
Fabrication of the backside of the SID
The microfabrication (fig. S12, i to x) starts with first PI coating on a silicon oxide wafer. Then, the first Al layer is deposited as an etch mask of the SID and patterned by photolithography and wet etching. The second PI layer is coated and the second Al layer is deposited by using the same process with the first Al layer. The second Al layer is patterned for the etch mask of the fuse. An epoxy layer (SU-8 2000.5, MicroChem Corp., USA) is coated and patterned for the bottom encapsulation layer. A Pt layer for bubble generation pads is deposited and patterned by a lift-off process. The first Cr/Au layer is deposited and patterned by a wet-etching process to fabricate the fuse. Then, the second Cr/Au layer is deposited and patterned for electrical interconnection of the SID. Last, an epoxy layer (SU-8 10) is coated and patterned for the top encapsulation layer.
Before integration of the lid and the drug reservoir (fig. S12, xi to xviii), poly(methyl methacrylate) (PMMA A11, MicroChem Corp., USA) is spin coated on the lid as a buffer layer. A PDMS stamp is attached to the lid to pick up the device from the wafer. Then, PI layers are patterned using dry etching with the Al etch mask. The Al etch mask is removed by wet etching. The surfaces of the drug reservoir and the lid are gently modified by oxygen plasma for improving affinity to the adhesive (NOA 73, Norland Products Inc., USA). The device is attached on the backside of the reservoir using the adhesive. Last, the PDMS stamp is detached, and the PMMA layer is removed by using acetone.
After integrating the lid and the drug reservoir, a thin encapsulation layer is applied to the chips integrated on the front side of the SID. A small amount of silicone prepolymer is applied to the front side and heat treated to create an encapsulation layer that prevents electrical leakage.
The drug (diazepam, 10 mg/2 ml, Samjin Pharm Co. Ltd., Republic of Korea) is loaded through an inlet hole on the SID lid (fig. S12, xix to xx). The drug is injected through the inlet hole of the device using a syringe with an ultrathin needle. Then, the inlet hole is encapsulated with an ultraviolet-responsive epoxy layer (NOA 73, Norland Products Inc., USA).
Immumnohistochemistry
To analyze the inflammatory cell infiltrations around the implanted device, the mice were deeply anesthetized and euthanized. The fibrous tissues that were directly encasing the devices were postfixed overnight in 4% paraformaldehyde, cryoprotected with 30% sucrose for 24 hours, and then sectioned at 20 μm using a cryostat (Leica CM 1900; Leica Microsystems GmbH, Germany). Sections were immunostained with H&E, anti-CD3 (no. 14-0032-82, Thermo Fisher Scientific Inc., USA), anti-CD20 (no. MA1-7634, Thermo Fisher Scientific Inc., USA), and anti-CD68 (no. 14-00681-82, Thermo Fisher Scientific Inc., USA) antibodies.
Analysis of the eluted metal ion concentration
To analyze the eluted metal ion concentration from the antenna, the SID was put in a glass bottle filled with 10 ml of deionized water. For the accelerated test, the solution was heated up to 80°C for 5 days. After 5 days, the media was collected, and hydrochloric acid with a concentration of 3% (v/v) was added. The metal ion concentrations of Sn, Bi, Ag, and Cu were analyzed by ICPS (ICPS-7500 spectrometer, Shimadzu Corporation, Japan).
1H NMR spectroscopy analysis of diazepam before and after electrolysis
To analyze the integrity of the drug during its release process, drug sample without any treatment and drug sample that was applied 8 V for 1 min were dissolved in D2O (151882, Merck KGaA, Germany). Extracts that were not dissolved in D2O were collected and dissolved in CDCl3 (151823, Merck KGaA, Germany). The samples were analyzed with 500-MHz NMR (Avance III-500, Bruker, Germany) installed at the National Center for Inter-university Research Facilities (NCIRF) at Seoul National University.
Analysis of the EEG signals and the survival rate of the SE mouse model
Male C57BL/6 mice (week 5 to 6) were used for the survival rate analysis. The EEG electrode implantation was performed as previously described (47). One week before the induction of the SE, the animals were anesthetized by 1% ketamine (30 mg/kg, intraperitoneal) and xylazine hydrochloride (4 mg/kg, intraperitoneal). Tungsten electrodes (0.005 inch, 2 megohms) were fixed onto the dural surface of the right hemisphere at anteroposterior (AP) −1.8 mm and lateral (L) 2.1 mm from the bregma with grounding over the cerebellum. Commercial equipment for the EEG analysis was PSG Twin 4.2 (AstroNova Inc., USA).
The epilepsy animal model was made by intraperitoneal injection of pilocarpine (400 mg/kg) into the subject mice. To minimize peripheral muscarinic effects, methyl-scopolamin (1 mg/kg) was injected 30 min before pilocarpine injection. In the case of the experimental group, diazepam (5 mg/kg) was administered to the subject mice 5 min after the onset of the SE via the SID (total volume of drug, 120 μl). After the SE, survived animals were fed with a 5% glucose solution until they started to eat normal food pellets. Spectrograms of the recorded EEG signals were created with MATLAB (MathWorks Inc., USA) for data visualization.
Quantification of the BBB permeability
Male C57BL/6 mice (week 6 to 8) were used for the BBB permeability quantification. Device implantation and the SE inducement were performed as previously described. In the case of the experimental group, diazepam (5 mg/kg) was administered to the subject mice 5 min after the onset of the SE via the SID, while diazepam (5 mg/kg) was intraperitoneally injected 40 min after the SE onset for the control group.
Three days after the SE, Evans blue (200 mg/kg) was intravenously injected via the tail vein of the awake, restrained mice. One hour after Evans blue injection, animals were anesthetized and perfused through the heart with 50 ml of cold saline and 50 ml of 4% paraformaldehyde in 0.1 M phosphate-buffered saline, sequentially. The brains were collected from the subject mice and photographed as a whole brain and an axially dissected (thickness, 2 mm) form. To quantify the extravasation of Evans blue, the dye was extracted in 1 ml of 4% paraformaldehyde (37°C, 13 hours), and the absorbance of the extract was measured at 620 nm.
Drug release demonstration from a large-size SID using human EEG data ex vivo
The prerecorded human EEG data during SE were obtained from a video-EEG monitoring database in an epilepsy monitoring unit. The use of the EEG data was approved by the institutional review board. The human scalp EEG electrodes were placed according to the protocol of International 10-20 system, while an additional anterior temporal electrode was used. Signals from the F3 channel against the average reference were used for the demonstration ex vivo. The prerecorded human EEG signals were applied to the custom-made wearable EEG sensor by using a multifunctional input/output device (USB-6289, National Instruments Corporation, USA).
Ethical approval
This study was approved by our Institutional Animal Care and Use Committee (IACUC; no. 18-0199-S1A1) and was performed in accordance with our IACUC guidelines and with the National Institutes of Health Guide for the Care and Use of Laboratory Animals.
Acknowledgments: Sangjun Kim thanks S. Liu for guidance on the FEA. We thank H.-N. Bae of the National Center for Inter-university Research Facilities for assistance with the NMR experiments. Funding: This work was supported by the Institute for Basic Science (IBS-R006-A1) and National Research Foundation of Korea (NRF-2017R1C1B2009892, NRF-2018R1A6A1A03025708, and NRF-2019R1A2C1009003). Author contributions: H.J., Y.L., J.K., Sanghoek Kim, S.-T.L., and D.-H.K. designed the experiments. H.J., Y.L., J.K., S.Y., Sangyeon Kim, S.-T.L., and D.-H.K. performed the experiments and analysis. A.K.A., Sangjun Kim, N.L., and Sanghoek Kim performed simulations. H.J., Y.L., J.K., J.-S.Y., S.Y., S.H.C., S.-T.L., and D.-H.K. performed in vivo animal experiments and analysis. H.J., J.K., H.S.L., S.-T.L., and D.-H.K. performed human EEG signal analysis. H.J., Y.L., J.K., Sangjun Kim, N.L., Sanghoek Kim, S.-T.L., and D.-H.K. wrote the paper. Competing interests: The authors declare that they have no competing interests. Data and materials availability: All data needed to evaluate the conclusions in the paper are present in the paper and/or the Supplementary Materials. Additional data related to this paper may be requested from the corresponding authors. We used LabVIEW 2015 to operate our custom-made circuits in our platform. The source codes are available from the corresponding authors upon reasonable request.