How do you rapidly record the output from your three million dollar analog computer in the 1940s when the results are only available on analog meters? The team responsible for the Westinghouse 1947 AC Network Calculator at Georgia Tech was faced with just this problem and came up with a nifty solution — hack the control panel and wire in a special-purpose drafting table.
What Is It?
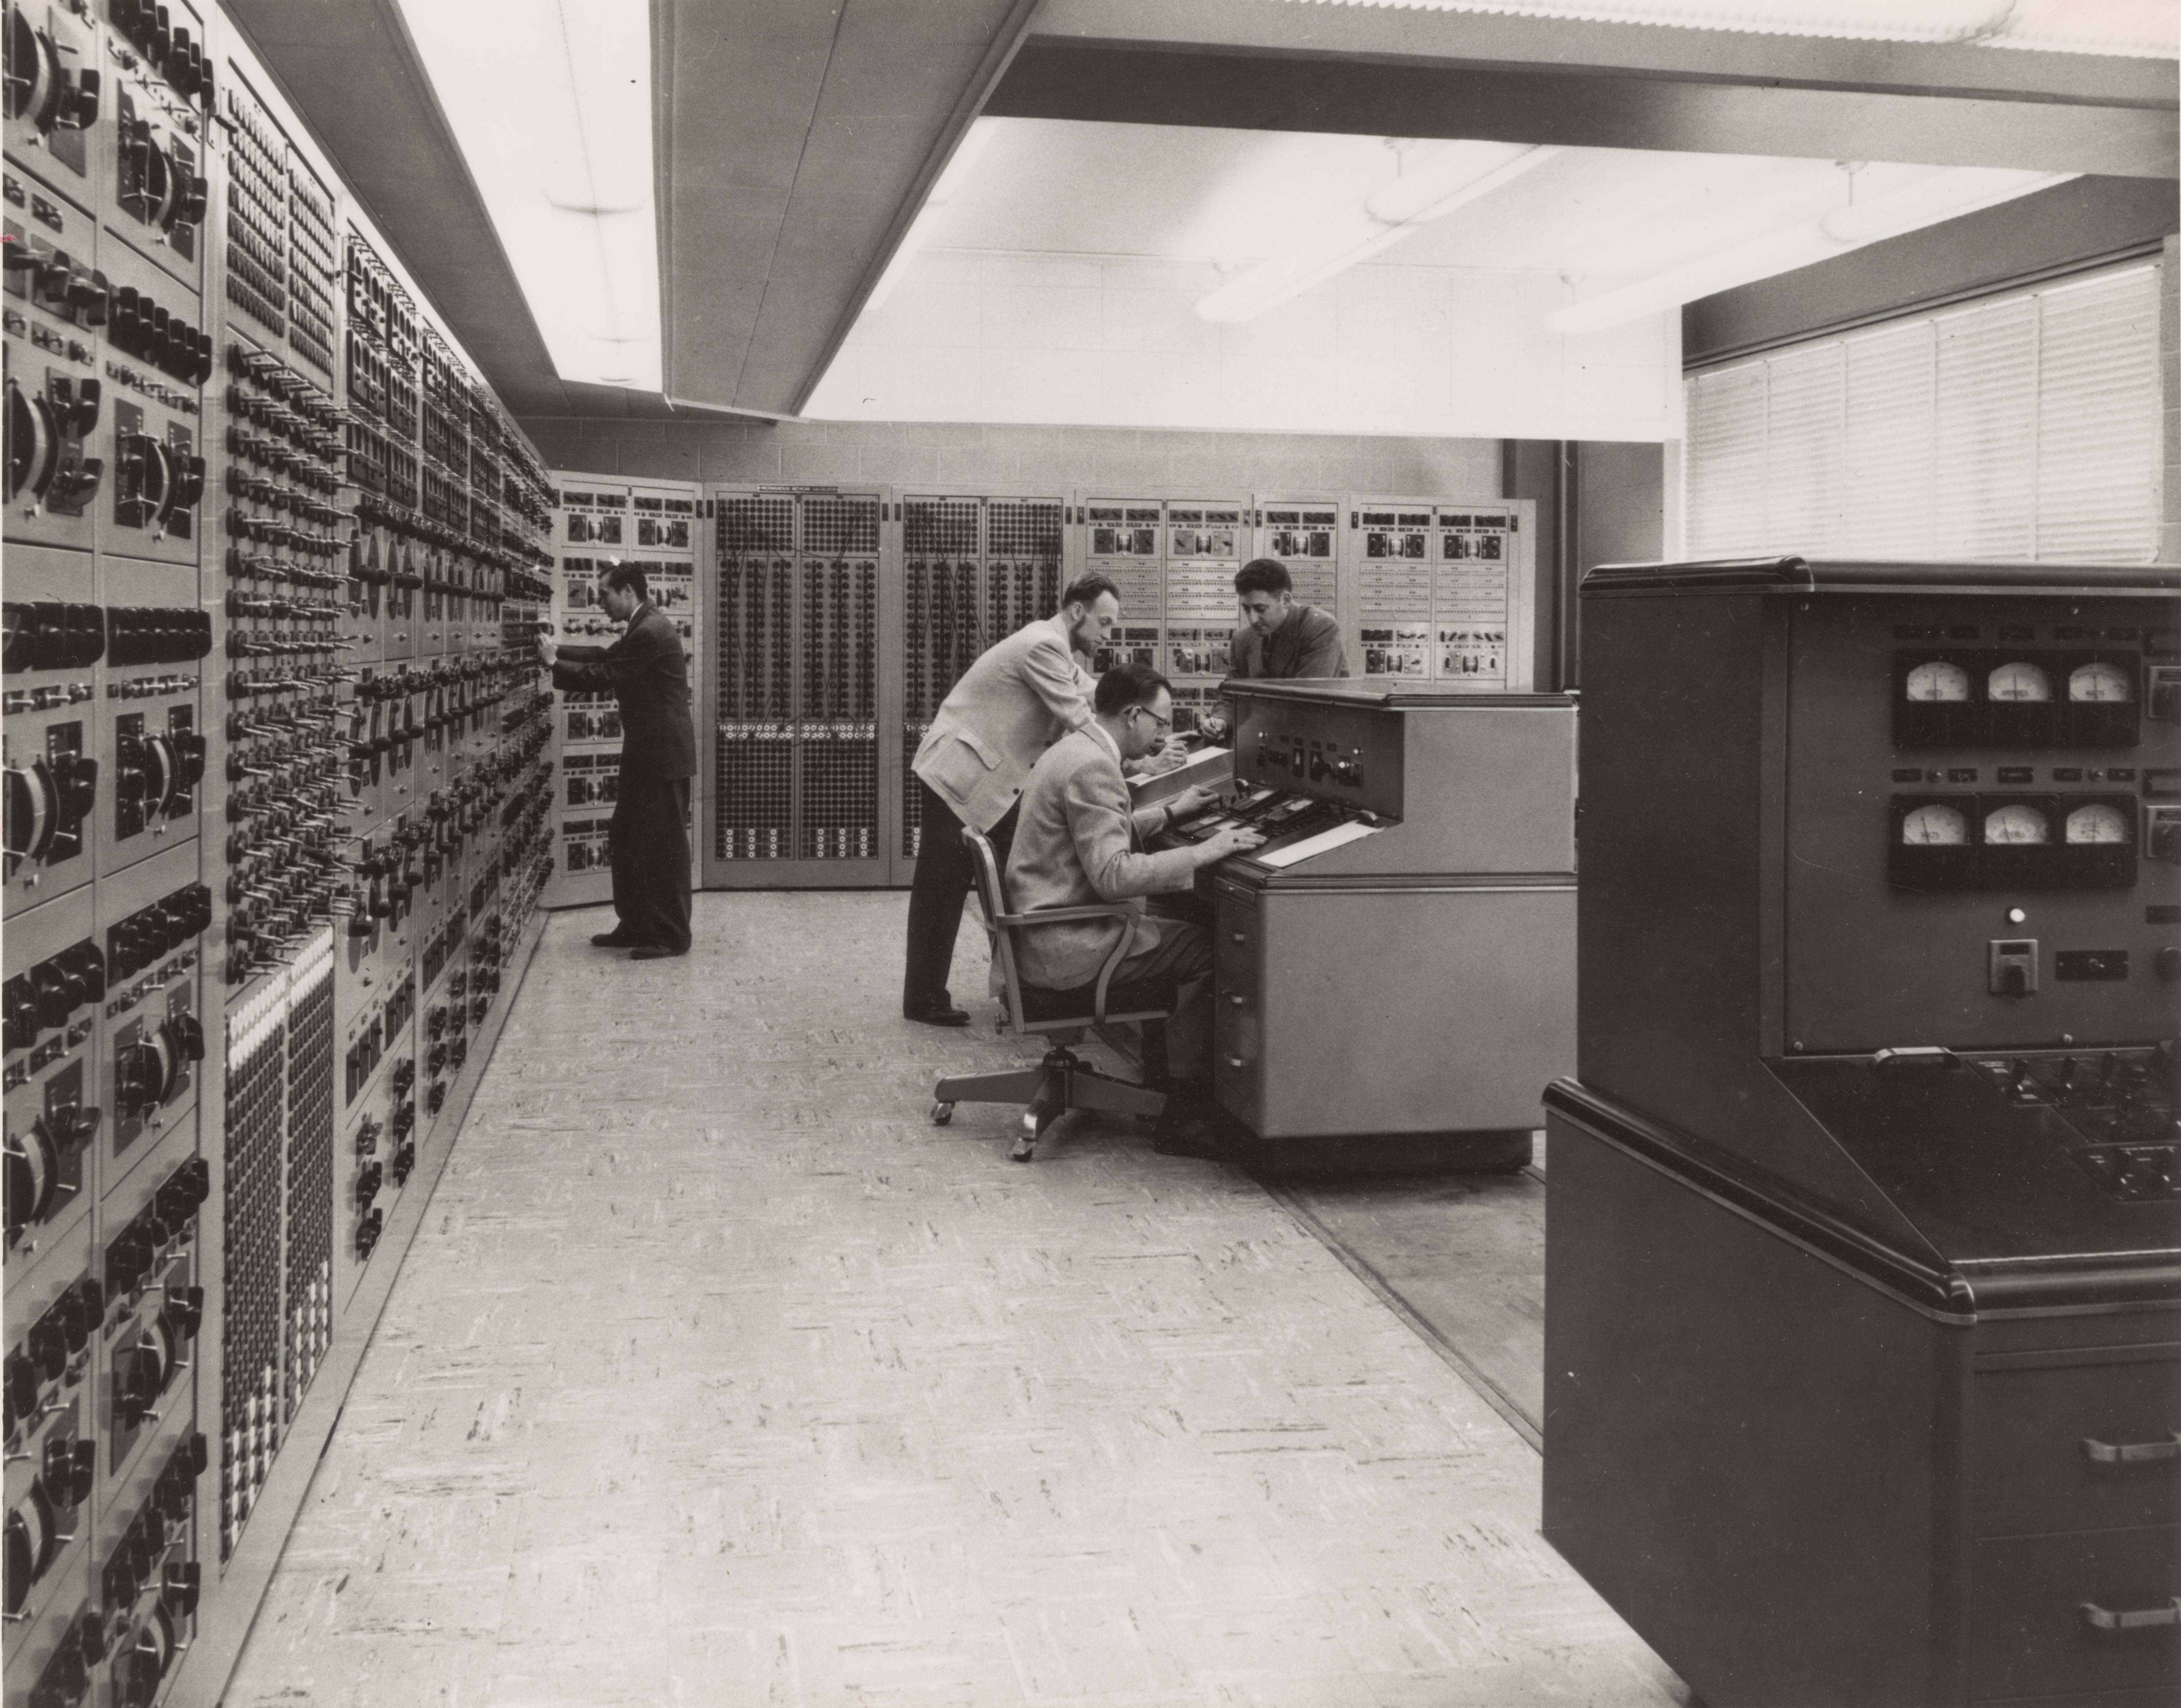
The engineers would “program” the machine by connecting together the appropriate circuit elements (like capacitors, inductors, transmission lines, generators, etc.) on big patch panels. Thus programmed, a 10 kW motor-generator located in the basement would be started up and the simulation was underway.
Part Time Job
Back in the early 1980s, my first job in college was to get one of these machines up and running. It had been purchased by Georgia Power and donated to Georgia Tech back in 1947, where it had seen more or less continuous service for several decades. It had then been used as a teaching aid for some time, and moved to a couple of locations. By the time of my involvement, it was unused and in a state of disrepair.
Surprisingly, it wasn’t that difficult to fix. The patch panels’ wiring needed replacement, as the insulation was brittle and cracked. Decades of crud was removed from the switches and contacts in all of the circuit elements. For several semesters, this quiet room in the basement was my refuge when I needed silence to study and read, occasionally entertaining myself by firing it up to solve random AC network problems from my textbook.
Operation
Once the motor generator set spun up to frequency and stabilized, you could monitor the simulated network by connecting the metering circuits in the operator’s console to any of the circuit elements. You did this by pressing the reference designator into a keyboard that looked like an old-fashioned mechanical adding machine (it probably was). Almost instantly, the element’s current, voltage and power would be displayed. These quantities were complex, so both magnitude and phase were presented on the meters.
The operators would obtained the simulation results by stepping through all the desired circuit elements. After each measurement, they would pause, record numbers in a notebook, and move on to the next element.
Interestingly, this whole process was basically a big passive circuit without any active components. Sure, there were relays for meter connections, and of course the motor-generator provided power for the voltage sources. Other than that, reading the output from the console was equivalent to having a technician carry test meters around to each circuit and probing the points by hand. There was one exception, one of the meters was driven by a small vacuum tube amplifier. But it was only used for one measurement type, I think it was VARS. Even with the amplifier turned off, the machine was completely functional and quite useful.
We Can Do Better
The team decided to modify the calculator so that results would be easier to record and interpret by the engineers. Their approach was to write the answers directly on the schematics, aided by the installation of a special drafting table next to the main operator’s console.
This drafting table’s top was like no other you’ve seen. It lifted up like the hood of a car, complete with supporting bracket. The table top was made primarily of metal, with a translucent material laminated on top to provide a smooth writing surface. The metal plate was perforated with small holes throughout in a regular grid pattern, accessible from the bottom. If you examined it closely, you would notice that the whole plate was connected to ground by a flexible braided strap.
Inside the table, there was a panel with a grid of hundreds of well-labeled pin-tip jacks. There was one pin-jack for each of the circuit elements — C1 to C99, L1 to L99, etc. The engineers dug into the main console keyboard and tapped into the appropriate logic signals. These were routed to new relay circuitry inside the table, and ultimately to the big panel of pin-tip jacks. Each of these circuits would be energized corresponding to the circuit element the operator engaged for metering.
There was also a big jumble of loose, single-conductor jumper wires inside the table. Each jumper wire had a pin-tip plug on one end and a small light bulb on the other. These light bulbs, T-1 3/4 midget flange base as I recall, could be gently pushed into any of the holes underneath the table, thereby grounding one side of the filament. The pin-tip plug on the jumper wire would be plugged into any desired jack on the panel, completing the circuit to the other end of the filament.
Getting output from the simulation now would require a new setup procedure. Not only did the circuit itself have to be “patched” in, but the indicator bulbs had to be connected. A schematic page was taped down on the drafting table. Then dozens of these light bulbs with jumper wires were put in place. Each bulb would be mounted in the hole underneath the corresponding element on the schematic. Then the wire would be plugged into the corresponding jack on the panel. For example, the light bulb plugged into the table underneath capacitor C16 would be plugged into the C16 tip-jack on the patch panel, and so on.
Once this rat’s nest of wires was hooked up, the table top would be closed and used like a regular drafting table. The network analyzer begins running, and one operator (at the console) would cycle through each of the various elements of interest, calling out the values from the meters. A second operator, at the drafting table right next to the console, would write the results directly onto the schematic, guided by the illuminated spot appearing under each element as it was selected by the operator. Looking back, this reminds me of a crude precursor to modern GUI SPICE simulators, where you hover your mouse or click on a circuit element to see these “metered” values.
Old Schematics
I found a schematic drawing of the meter selection circuitry from a patent filed in 1940. I found it very interesting, if only because of the different symbology and style from today’s schematics. You don’t see such a mass of relays very often these days, but if you study it briefly you can understand the gist of the circuit. It’s basically a 24-wire decimal-digit address bus, with a units and tens place. What would be the hundreds place consists of only four wires instead of ten. These are used to select the category of circuit element, such as power supply, capacitor, etc. The keypad drives the address bus, and the RESET button releases the “drivers”.
Digging around in the desk drawers one day, some friends and I found an old article about Herbert Peters, a colorful Westinghouse engineer who transferred to Georgia Tech with the network analyzer and ended up living in Atlanta for the rest of his life. Mr Peters seemed to be the epitome of an old-school, hard-core engineer. We could picture him in our minds, sporting that bow-tie, hunched over the computer deep in thought, absentmindedly brushing aside the occasional cigarette ash that would fall on the console.
Although I never met him, I heard that he returned to consult on a project after I graduated. He encountered a transistor amplifier that I had worked on for months to replace the old broken vacuum tube amp. With barely a second thought, he tossed my chassis in the trash can and proceeded to fixed the tube amplifier in less than an hour. As a result, designing transistor amplifier circuits gives me pause to this day.
Not long after I graduated in 1985, I heard that half of the network analyzer was thrown away in order to save space. The basic core was preserved — just the number of circuit elements was cut in half. Some years ago, even this remaining half was finally surplussed. Today all that remains are fading photos, a 10 kW motor-generator set in the basement, and the fond memories of those who once used this majestic machine.
I want to thank Dr Roger Webb, the professor who hired me to work on this machine so many years ago. He shared his recollections with me after discovering that his archives on the Network Analyzer had been discarded by the university a few years back.