


Amplitude and power in RF signals are measured mainly with RF power meters, spectrum analyzers and oscilloscopes. A power meter gives the most accurate total power, a spectrum analyzer shows power against frequency, and an oscilloscope shows voltage against time. Results are normally quoted in dBm, and turning them into volts requires the system impedance, usually 50 Ω.
Accuracy depends on more than the instrument. Attenuators and cables must be accounted for, mismatch adds uncertainty, signals near the noise floor read high, and detectors respond differently to modulated signals. The sections below cover each of these, with a worked example of reading a high-power transmitter safely.
Amplitude and Power: How They Relate
Amplitude describes voltage. It can be stated as peak, peak-to-peak or RMS, and for a sine wave Vpk = √2 Vrms and Vpp = 2Vpk. Power in a resistive system is:
P = Vrms2 / R
RF engineers usually measure power and not voltage. At high frequency a voltage depends on where along a line it is measured, because of standing waves, but power flow is well defined. Power also adds predictably through a chain expressed in decibels. The article on dB, dBm, dBW and dBc explains the logarithmic units.
For a sine wave in 50 Ω, the conversion between dBm and RMS voltage is Vrms = √(50 × 10(PdBm – 30)/10), and these values come up often:
| Power (dBm) | Power | Vrms in 50 Ω |
|---|---|---|
| -30 | 1 µW | 7.07 mV |
| -10 | 100 µW | 70.7 mV |
| 0 | 1 mW | 224 mV |
| +10 | 10 mW | 707 mV |
| +20 | 100 mW | 2.24 V |
| +30 | 1 W | 7.07 V |
Instruments for Measuring RF Power and Amplitude
RF Power Meter and Sensor
A power meter is the reference for absolute level. Thermal sensors respond to true average power whatever the waveform, at the cost of slow response. Diode sensors are faster and much more sensitive, but in their upper range they depart from true RMS behaviour on modulated signals, unless they are designed and calibrated for this. A meter reports everything in its input band, so harmonics and spurious signals are included in the reading.
Spectrum Analyzer
A spectrum analyzer separates the signal by frequency, so it can measure one tone beside others, and harmonics or adjacent channel power, as well. Its absolute accuracy is typically poorer than a power meter’s, so a common method is to set the level with a meter and use the analyzer for relative measurements. Settings matter: the resolution bandwidth, detector type and input attenuation all affect the reading.
Oscilloscope
A high-bandwidth oscilloscope shows the time waveform, including pulse shape and envelope. It is the natural choice for pulsed signals and for voltage at a node. Its amplitude accuracy is usually lower than that of the other two, and a high-impedance probe can load a circuit, so a 50 Ω input is preferred at RF.
Detectors in a System
Inside a product, power is monitored by a diode detector or log amplifier, often fed by a directional coupler. A coupler can sample forward and reflected power separately, which gives a live measure of the load as well.
Worked Example: Measuring a Transmitter Output
A transmitter output feeds a 30 dB power attenuator, then a cable with 1.2 dB loss, then a power sensor. The sensor reads +8.4 dBm. What are the output power and voltage?
Total offset = 30 + 1.2 = 31.2 dB
Output power = 8.4 + 31.2 = +39.6 dBm = 9.12 W
In 50 Ω, this corresponds to:
- Vrms = √(9.12 × 50) = 21.4 V
- Vpk = 30.2 V
- Vpp = 60.4 V
Two practical points follow. First, the attenuator must handle the full power, here about 9 W, and it should be rated with margin for peaks and duty cycle. Second, attenuation and cable loss should be measured at the actual frequency, since nominal values may be several tenths of a decibel out. Enter the offset into the meter so that the display shows the true level. RF attenuators explains the pad types.
Mismatch Uncertainty
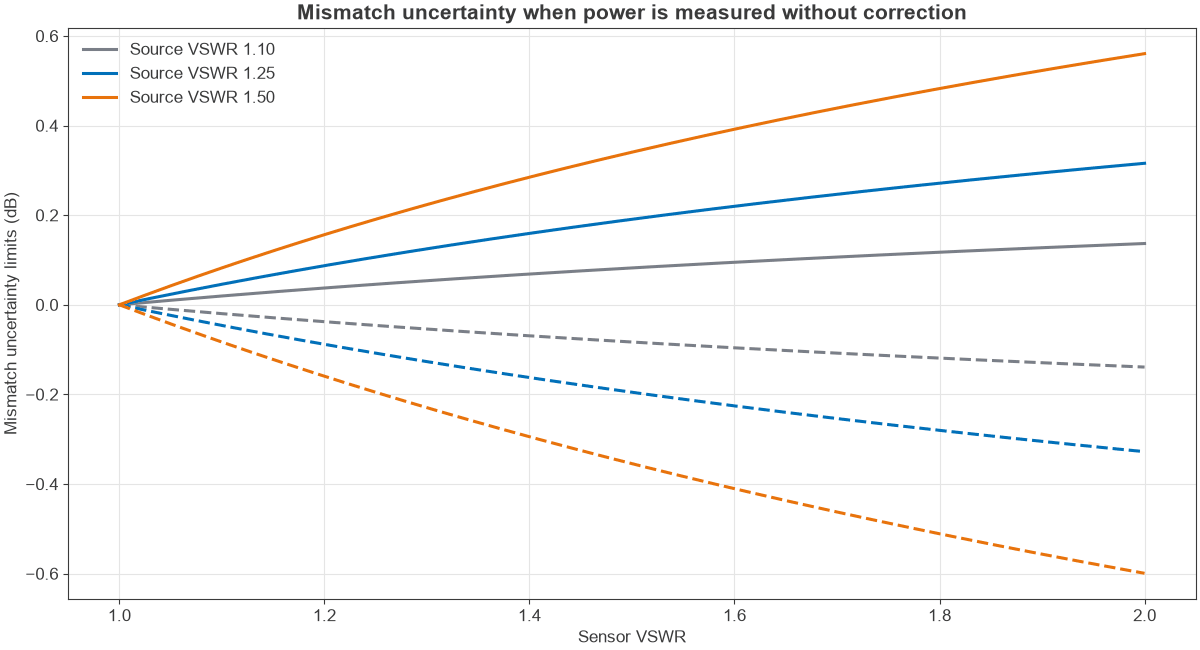
The main error in many RF power measurements comes from reflections between the source and the sensor. If neither is perfect, some power bounces between the two, and the amount depends on an unknown phase. The limits of the error are:
Mismatch uncertainty = 20 log10(1 ± |ΓS||ΓL|) dB
Take a source with a VSWR of 1.25 and a sensor with a VSWR of 1.15. The reflection magnitudes are 0.111 and 0.070, so the uncertainty is ±0.067 dB. That is a small figure, as both ports are good. Figure 1 shows how fast it grows with poorer ports. A sensor at a VSWR of 2 with a source at 1.5 gives roughly +0.56 dB and -0.60 dB. This is often larger than the sensor’s own specification, and an attenuator pad at the sensor input can reduce it.
Measuring Near the Noise Floor
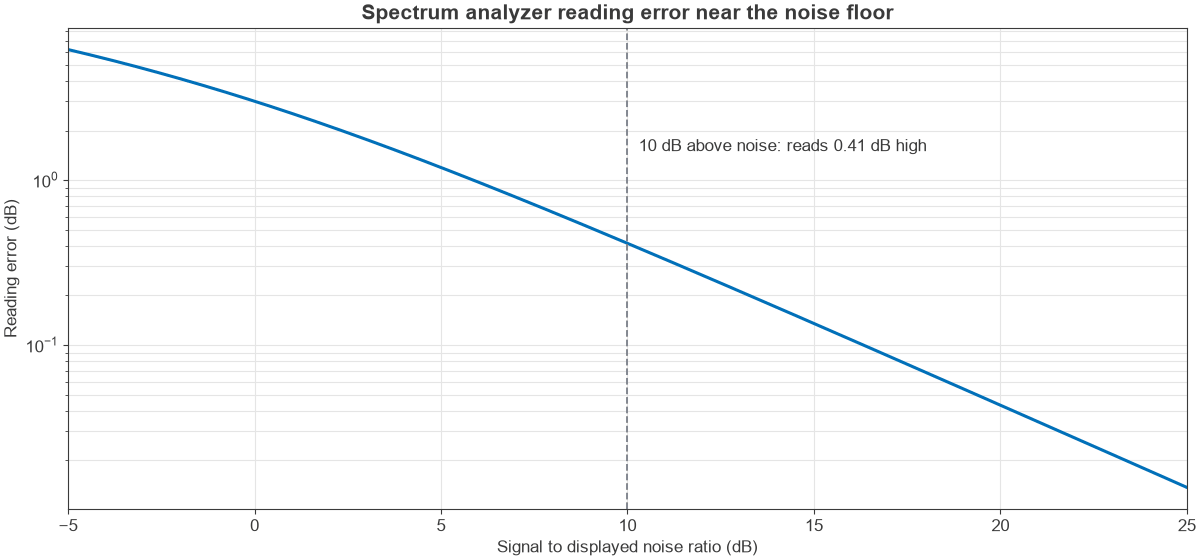
A spectrum analyzer adds its own noise to the signal, and the display shows the sum of the two powers. At a signal 10 dB above the noise, the reading is high by 10 log10(1 + 0.1) = 0.41 dB. At 3 dB above the noise it is high by 1.76 dB, and at 20 dB above it only 0.04 dB, as Figure 2 shows.
When the noise level is known, the true power can be recovered by subtraction in linear units. As an example, a displayed level of -92 dBm against a noise level of -95 dBm gives a true signal of about -95.0 dBm. Be careful with this correction, because analyzer detectors and averaging modes affect how noise is displayed. Reducing the resolution bandwidth and the input attenuation will usually lower the noise level and is a better fix than correcting afterward.
Average, Peak and Envelope Power
A CW tone has a constant envelope, so a single power figure describes it. A modulated signal does not. Average power indicates heating and range, while peak power indicates compression and breakdown.
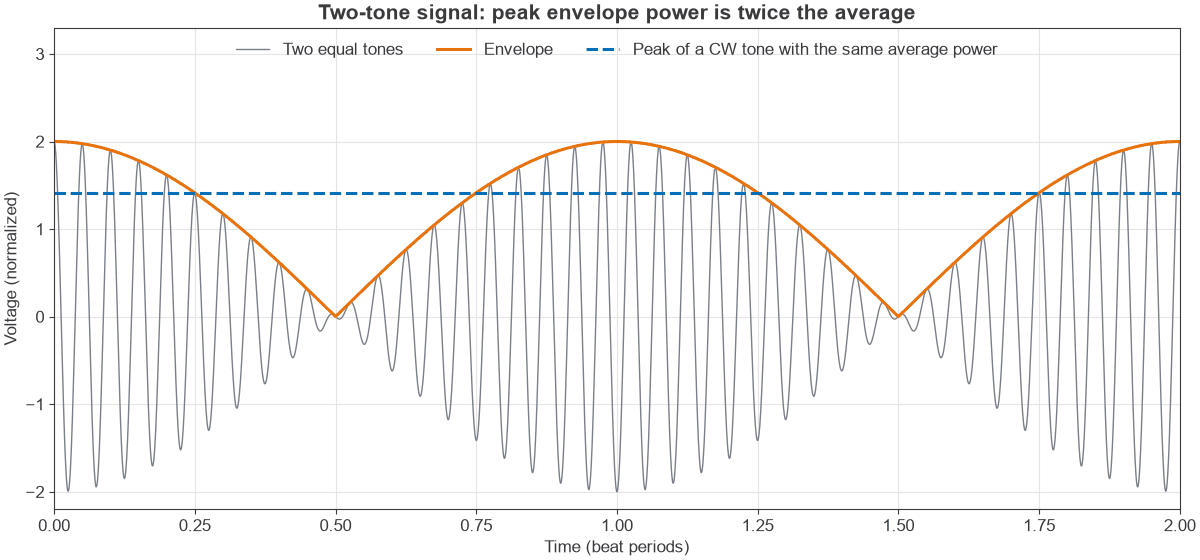
A two-tone test signal makes the difference easy to see. With two equal tones, the envelope swings between zero and twice the amplitude of one tone, as Figure 3 shows. Its peak envelope power is 3 dB above its average power. Digital signals are more demanding, and OFDM has a peak-to-average power ratio commonly around 8 dB to 12 dB, depending on clipping.
Measuring these signals needs a suitable method. A thermal sensor gives the correct average, and a peak power sensor or a wideband analyzer mode gives the envelope. A diode sensor used outside its square-law range can read well away from the true average value.
Calibration and Good Practice
Good habits prevent most measurement errors:
- Zero the sensor before low-level readings, and check it against the reference if it has one.
- Keep instrument calibration current, traceable to a recognised standard.
- Inspect, clean and torque connectors. A damaged connector can cost more than any instrument error.
- Allow instruments to warm up, and let thermal sensors settle.
- Check the maximum input level of the instrument, and add attenuation before connecting a transmitter.
- Use the shortest stable cables, since flexing them changes loss and phase at high frequency.
For more on calibration of ratio measurements, see VNA calibration. The RF measurement hub covers noise figure and phase noise methods too.
Frequently Asked Questions
What is the best instrument for measuring RF power?
For absolute average power, a power meter with a suitable sensor is the most accurate. For a single signal among several, a spectrum analyzer is more suitable. Many labs use both.
How do I convert dBm to voltage?
Convert dBm to watts with P = 10(dBm – 30)/10, and then use Vrms = √(P × R). For example, 0 dBm in 50 Ω is 224 mV RMS, which is 316 mV peak for a sine wave.
Why does my spectrum analyzer read differently from my power meter?
The meter measures all power in its band, while the analyzer measures the power in its selected bandwidth with a chosen detector. The analyzer also has a larger level uncertainty, and modulated signals can read low if the bandwidth or detector is unsuitable.
Can I connect a transmitter directly to a power sensor?
Only if its power is within the sensor’s maximum rating, which is often low. Otherwise use a rated attenuator or coupler between them, and account for that loss in the reading.
Related Topics
Read understanding power in RF systems for the theory behind these measurements, and see the RF fundamentals hub. Measuring radio performance applies them to full transceivers.